Pentaho Analyzer

Use Analyzer to create visualizations and analysis reports from your data. Analyzer has an easy-to-use, web-based, drag-and-drop design environment which can be used by anyone who wants to dynamically explore data and drill down to discover previously hidden details.
Before you can use Analyzer, you must have access to a data source. Only system administrators can create data sources. The data source for Analyzer is based on the Mondrian multidimensional data model. The Mondrian data model enables you to choose which dimensions and measures you want to explore in your data.
Get started with Pentaho Analyzer
Procedure
-
From the User Console Home page, click the Browse Files button. In the Browsing pane, click to expand the Public folder, then click to expand the Steel Wheels folder.
-
In the center pane, double-click on European Sales. The Opened page appears with the Analyzer report. Click the Add More Fields and Rearrange Fields icons on the toolbar to expand the Available Fields and Layout panels.
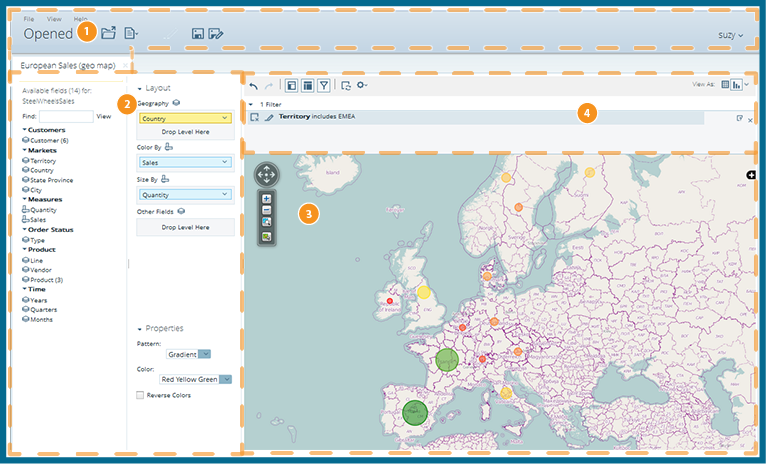
Item Name Function 1 Opened view Displays quick access buttons across the top to create and save new Analyzer reports, Interactive Reports, and Dashboards. Opened reports and files show as a series of tabs across the page. 2 Available Fields and Layout panels Use the Available Fields and Layout panels to drag levels and measures into a report. Your report displays changes in the Report Canvas as you drag items onto the Layout panel.
Delete a level or measure from your report by dragging it from the Layout panel toward the lower right corner of the Report Canvas. As you drag it, a trash can icon appears in the lower right corner of the canvas.
3 Report Canvas Shows a dynamic view of your report as you work to build it. The look of your report changes constantly as you work with Available Fields and Layout panels to refine it. The Report Canvas shows different fields based on the chart type selected.
4 Analyzer Toolbar and Filters Use the Analyzer Toolbar functions to undo or redo actions, hide lists of fields, add or hide filters, disable the auto-refresh function, adjust settings, and change the view of your report. Use the Filters panel to display a list of filters applied to the active report, or edit or delete filters.
Creating Analyzer reports
Creating reports in Pentaho Analyzer allows you to easily compare data, such as the actual versus budgeted expenses by region for each of your departments, or the amount of sales by region. You can enhance your reports by adding visualizations and charts.
Create an Analyzer report
To create a new report, perform the following steps:
Procedure
-
From User Console Home, click Create New, then Analysis Report.
-
Choose a data source for the report from the Select Data Source dialog box, then click OK.
-
From the Available Fields pane on the left, click and drag an object to the Rows or Columns area in the Layout panel.
The data row or column appears in the table workspace.NoteYou can remove an object from a row or column by dragging it from the Layout panel back to the Available Fields list. -
In the list of fields, click and drag a measure to the Measures area in the Layout pane.
The measure appears as a column in the table workspace. -
If you want to rename or reformat your columns, right-click a column and choose Column Name and Format from the menu.
The Edit Column window appears.NoteYou can also sort the data in your columns by clicking and choosing a sort-order from the drop-down menu. -
Choose a format from the Format drop-down box, or choose a visualization from the drop-down menu. Click Refresh Report if you need to, then click OK.
-
Click Save As. Type a file name for your report and choose a location to save it in, then click OK.
Results
View and edit Analyzer reports
When you open a report from the Analyzer, by default the report opens in view mode. Click the Edit (pencil) icon to edit the report.
If you do not see the Edit icon, contact your administrator.
Visualizations for Analyzer reports
After you have created an analysis report, you will most likely want to make the report more visually pleasing and meaningful for your audience. Analyzer has quite a few built-in visualizations that give you an effective means for presenting your data in a way that people can intuitively understand.
Chart options for Analyzer reports
The Chart Options dialog box is available if you have a visualization applied to your report. Click Chart Options in the Properties panel to bring up the chart options for that report.
Display the member properties of a field or level
Perform the following steps to filter by member properties:
Procedure
-
Locate a dimension in the Available fields list that includes a number in parenthesis, for example, Customer (6), or Product (3).
-
Locate the corresponding dimension on your report. Right-click the row or column header for that dimension, then click Show Properties.
A menu displays member properties you can choose. -
Select or clear the member property you want in the report, then click OK.
Results
Adding filters to an Analyzer report
In Pentaho Analyzer, filters are used to restrict or limit data in a report, so you can build the report to show only the information that you want to view. For example, a typical report shows sales by product line. By applying a date filter on Quarter, you can restrict the data so that only sales for the one quarter are shown. If you add a string filter for Europe, the report would display data for the European sales that quarter. If you add a string filter on another field to exclude a product line, the report would display European sales data in that quarter minus the excluded product.
You can apply a filter by selecting it from a list, or you can choose a specific type of filter to refine the data the way you want:
Add filters to an Analyzer report
Procedure
-
Log in to the User Console, then click Browse Files to browse to the location of your Analyzer report, or choose .
-
Open the existing report. If creating a new report, select the data source that you want to use and click OK, and then enter the data dimensions for the report in the Layout panel.
-
Click the Add A Filter icon.
A workspace for filters appears near the top of the report. -
Drag a field or column into the filter workspace from the Available Fields pane.
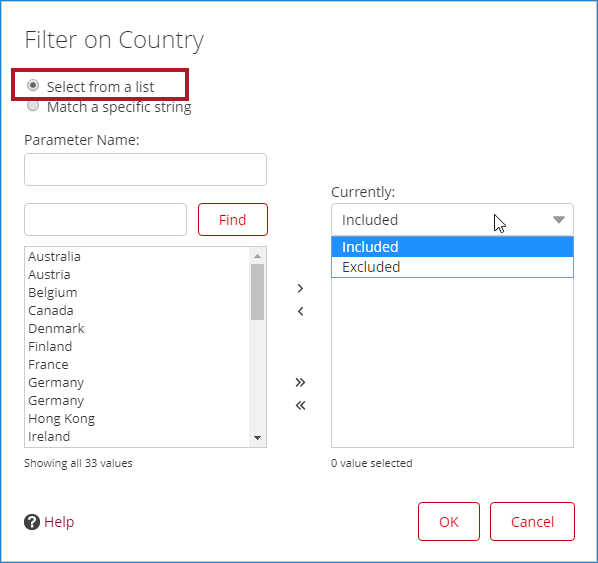
The Filter dialog box appears. The Select from a list option is selected by default. -
Click in the Currently field, and then select Included or Excluded from the drop-down menu to define how selections are filtered.
-
Select the value (or values) that you want to use in the Add Selected list and click the Arrow to move your selections into the right pane, or click the Double Arrow to move all the values.
The value or values appear with a check mark in the right pane.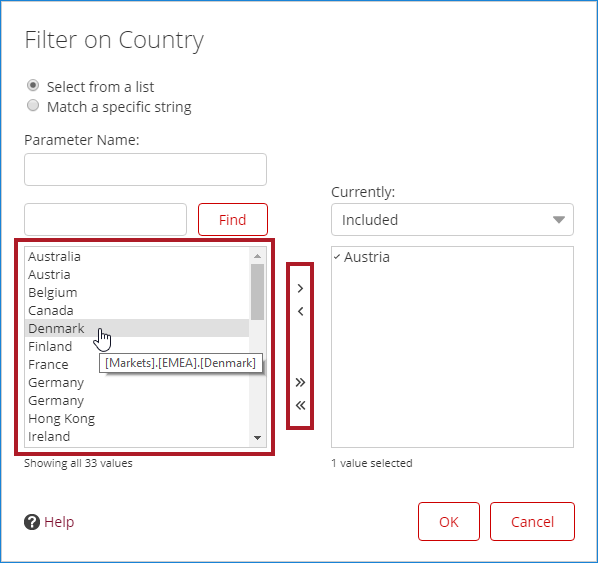
-
After you have selected all the values that you need from the list, click OK to exit the dialog box. Your Analyzer report displays data for the chosen values only.
-
Save your report. You can click Undo or Reset to return to the previous version of the report.
Filter on date levels
Date level filters allow you to use relative dates and date range operators to find a dynamic list of time periods. For example, if you want to view the sales for this quarter versus sales for the same quarter one year ago, then you can select the date filter and enter the respective dates.
Filter on numeric levels
Numeric level filters allow you to use comparison operators to quickly find a group of dimension members. For example, if you have a 'Credit Limit' level in a customer dimension and you want to show sales only for customers with a credit limit greater than $50,000, then you can create a numeric filter, such as "Credit Limit > $50,000."
Filter on string levels
String level filters allow you to use contain expressions to match similar dimension members. For example, if you have a 'Street' level in a customer dimension and you want to view all customer addresses with physical street locations, then you can create a string filter like "Street."
Filter on measure values
Measure filters allow you to select dimension members based on each member's measure value. For example, if you have a 'Total Sales' level in a customer dimension and you want to view all customers with total sales greater than $10,000, then you can create a measure filter such as "Customers who have Total Sales > $10,000".
Use fields in Analyzer
Analyzer uses fields and filters to format your report. You can think of a report as a file (like a spreadsheet file), except that when you open a report or make a change, the report connects to your database so it displays the latest data. Reports are stored in a repository, so you can access reports from any computer.
Use measures in Analyzer
You can work with measures in several ways to accomplish tasks, such as renaming a measure, creating a calculated measure, and editing a calculated measure.
Set Analyzer report options
You can modify how blank measures display, define drill-through columns, and show or hide totals for columns and rows. You can use the Report Options dialog box to change these options.
Export an Analyzer report
Procedure
-
In the Analyzer toolbar, click .
-
Select an output format from the menu. The Export dialog box appears.
If you are exporting to:-
PDF
Specify how you want the page formatted.
-
CSV
Specify formatting options and the Separator character. The default separator is a comma (,).
-
Excel Workbook
Specify how you want the workbook formatted. You can select or clear the Merge pivot table cells option.
- Select this option to keep nested pivot row and column headers grouped together.
- Clear this option to separate nested pivot headers to individual rows for easier sorting.
NoteMaps are not supported for export to Excel.
-
-
After specifying or modifying the export options, select one of the following actions:
Done Saves any modifications to the export settings, but does not export. Export Applies the options and generates output. If your report includes a chart, it is included in the report along with the table view. Cancel Discards all changes. -
(Optional) If you want it to keep the export settings, you must Save the report.
Results
Advanced topics
The following topics help to extend your knowledge of Analyzer beyond basic setup and use:
- Define Hyperlinks
You can manage the amount of information displayed in a report by hyperlinking to other related reports, charts, dashboards, and URLs.
- Add Query Parameters to Analyzer Reports
You can parameterize a query as a filter in Analyzer.
- Apply Conditional Formatting to Measures
You can physically affect the appearance of cells in the Analyzer data grid by the data they contain.
- Use Calculated Measures in Analysis Reports
You can define calculate measures based on customizations to base measures in the data model.
- Export an Analyzer report through a URL
You can export an Analyzer report as a PDF, CSV, or Microsoft Excel file from a repository through a URL. This is useful when you want to export reports from a different scheduler.
- Customize Pentaho Analyzer
You can configure Analyzer properties by editing a file.