Deploying a visualization

The Pentaho platform is built on top of an OSGi container (Apache Karaf). It allows for a modular approach at both development time and runtime, reducing complexity and facilitating deployment.
For example, to deploy the sample D3 bar chart visualization from the tutorial to
Analyzer, copy the TGZ file into
the pentaho-solutions/system/karaf/deploy folder.
OSGi artifacts deployment
The Pentaho platform supports deployment via dropping files into the deploy folder. Artifacts are automatically installed and activated even after you restart of the product. Replacing an artifact in the deploy folder will reinstall it. Deleting it in the folder, will uninstall it.
The deployer is able to handle ZIP and TGZ files (such as the files generated by the npm pack command) that include web resources described by a package.json file. Multiple web packages can be contained in a single archive, which provision visualization’s dependencies for example.
Depending on the Pentaho product, the Karaf deploy folder is in either of the following locations:
PDI
system/karaf/deployPentaho Server
pentaho-solutions/system/karaf/deploy
Inspecting tutorial results
After deploying the sample tutorial project, the D3 bar chart visualization now appears in Analyzer and PDI. It is also available in a CDE dashboard.
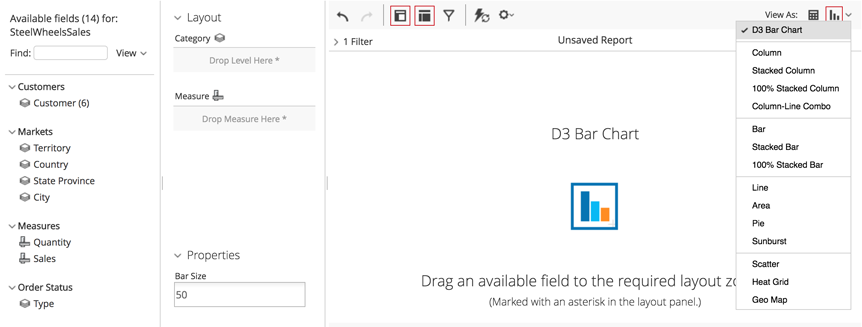
- The D3 bar chart visualization menu and placeholder icon appear on the
canvas, as shown in the following example:
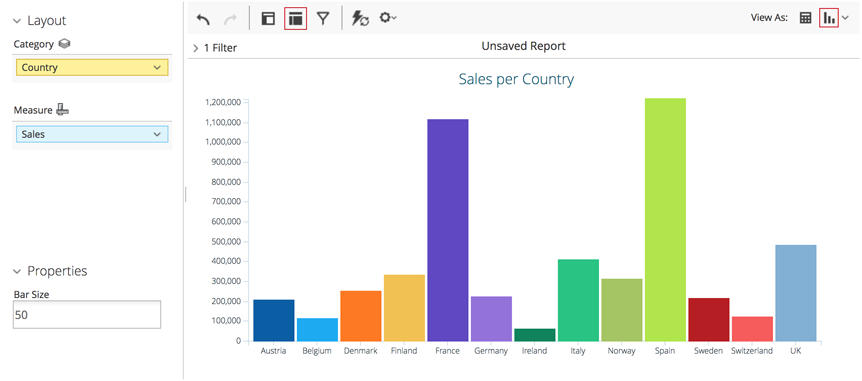
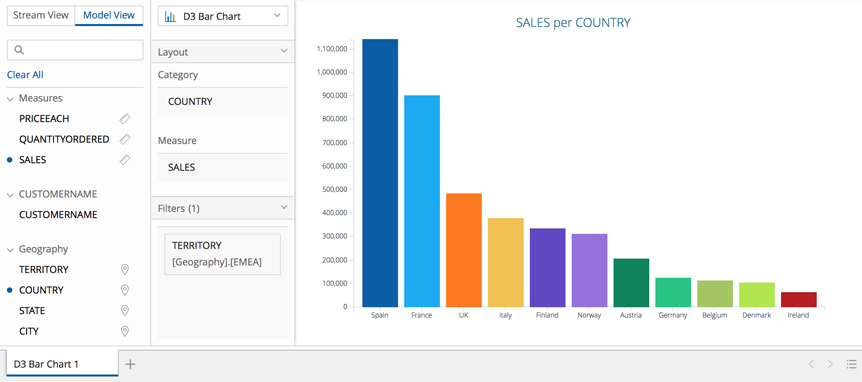
- The D3 bar chart visualization fully renders, as shown in the following
example:
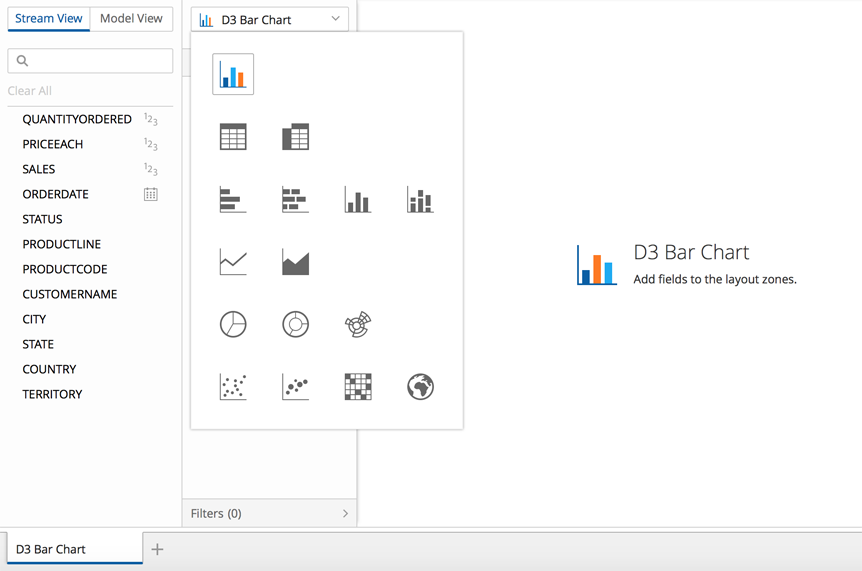
- The D3 bar chart visualization menu and placeholder icon appear on the
canvas, as shown in the following example:
- The D3 bar chart visualization fully renders, as shown in the following
example:
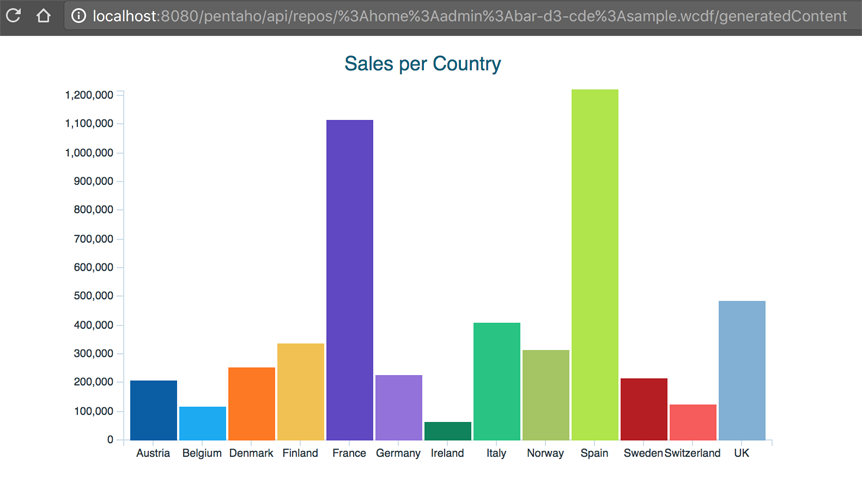
The D3 bar chart is available for use in a dashboard. You can obtain the
following dashboard from the pentaho/pentaho-engineering-samples
directory: