OLAP Log Output

The Pentaho Server and the standalone Mondrian engine both use log4j to record information about generated OLAP-generated SQL queries. It may be useful to examine this log output if you are having trouble with configuration or performance-tuning.
Analysis SQL output logging
You can log SQL generation, MDX generation, and debug MDX execution information in the Pentaho Server, Mondrian engine, or Schema Workbench.
The existing log4j2.xml configuration in the Pentaho Server includes the following rolling file appenders:
SQLLOG
Logs all SQLs generated by Mondrian including execution times and row counts. Executing the same MDX statement a second time will generally result in no additional SQL logging because Mondrian caches data from the first MDX statement
MDXLOG
Logs all MDXs executed by Mondrian including execution times.
MONDRIAN
Logs detailed MDX execution information such as dynamic schema processors used, aggregate tables found, segment creation, execution phase events, named set evaluations, etc. Only use this appender to troubleshoot specific schemas and queries as it generates extremely verbose logging.
Follow the directions below to turn on this SQL logging.
Procedure
Stop the Pentaho Server standalone Mondrian engine or Schema Workbench.
Open the
log4j2.xml configuration file in a text editor. For Pentaho Server, this is located in theserver/pentaho-server/tomcat/webapps/pentaho/WEB-INF/classesdirectory. For standalone Mondrian engine, this depends on your runtime environment such as whetherlog4j2.xmlis read from the classpath or configured as a JVM parameter. For Schema Workbench, please refer to theworkbench.bat/shstartup script to find the location oflog4j2.xmlAdd the
log4jappender and associated logger. By default, each appender has its own logger that references that appender via the appender-ref attribute. If you are enabling logging for a standalone Mondrian engine or Schema Workbench, refer to an existing Pentaho Server installation and copy the relevent appenders and loggers into thelog4j2.xml used by Mondrian or Schema Workbench.Save and close the file.
Start the Pentaho Server, Mondrian engine, or Schema Workbench.
Results
Enabling segment cache logging
The Pentaho Server allows you to view engine segment cache logs by opening the log window from within Analyzer.
If you are using Analyzer with a standalone Mondrian engine, cache log information is available
through log4j. Edit your log4j configuration as
explained in Analysis SQL output logging, and set the value of
com.pentaho.analysis.segmentcache to DEBUG. The table
below lists other log4j categories that can help you diagnose
configuration and performance problems.
| Class Name | Cache System |
com.pentaho.analysis.segmentcache.impl.infinispan | Outputs information related to the Infinispan implementation of the segment cache. |
com.pentaho.analysis.segmentcache.impl.memcached | Outputs information related to the Memcached implementation of the segment cache. |
com.pentaho.analysis.segmentcache.impl.pentaho | Outputs information related to the Pentaho BI Platform Delegating Cache implementation. |
View Log Output in Analyzer
You can view the log in Analyzer.
Perform the following actions to view the log in Analyzer:
Procedure
Create a new Pentaho Analyzer report and drag a measure or a dimension in the report.
Once your report is displaying numbers, click on the top link, identified as More actions and options, and choose item.
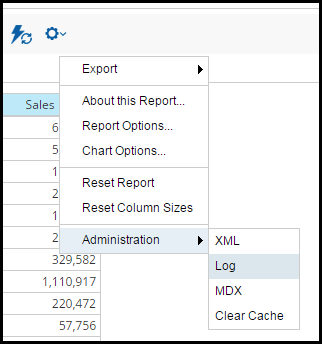 NoteIf there is no such link available within Pentaho Analyzer, it is because you have not used an administrator account to login to Pentaho User Console. You must log out and log back in using an administrator account credentials.
Results
If your plugin was successfully configured, you should see log information relating to the segment cache. If there was an error in your configuration, all exception messages will be displayed here as well.