More about row banding, data formatting, and alignment

Row banding
By creating a row band element, you can select
the specific fields in your report that will display a row band. For example, you may want
to emphasize specific fields and not others on a line. You can give your row band element
any name you choose. In the example below, the row band Element is
called row-band-element.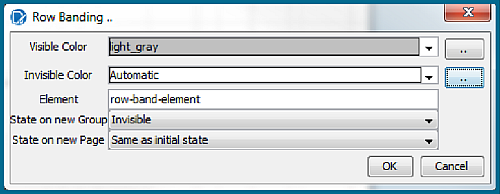
After you create your element, go back to the report and select the columns
(fields) whose data will always be displayed with a row band. You must also type
row-band-element in the name field under
Attributes. In the example below, the data associated with each of
the columns in the report will display a row band. Notice the banding in the report
preview.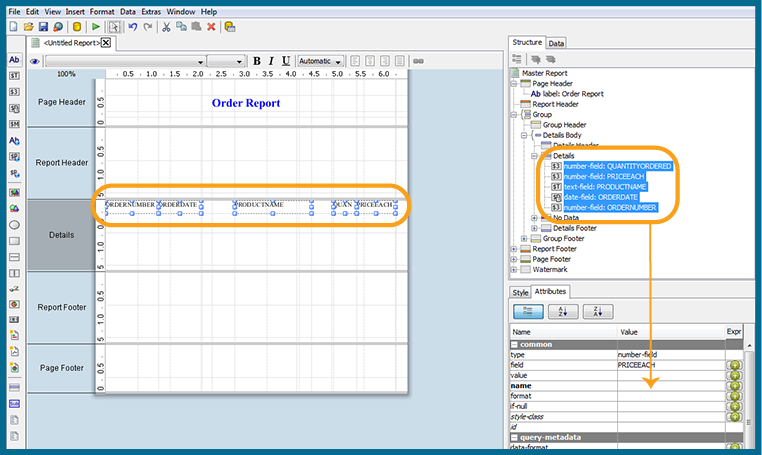
Data formatting
Report Designer uses default formats for dates and numbers. You can
change how dates and numbers display by selecting the object (field) and selecting the
appropriate value for the format from the drop-down list next to
format (under Attributes). In the example
below, the dates associated with the Order Date field will display as
MM-dd-yy.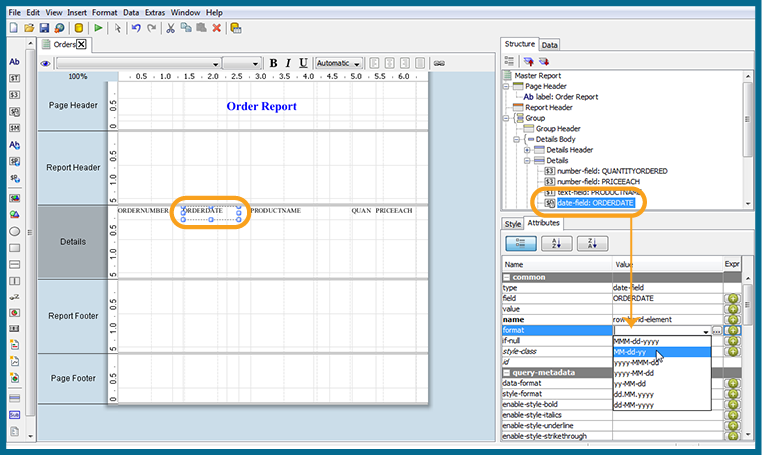
When you preview the report, notice that it displays in a cleaner format: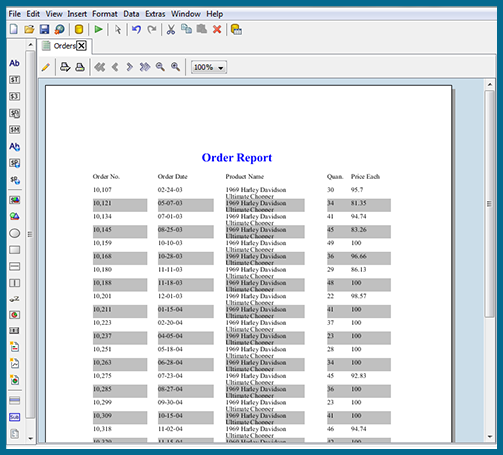
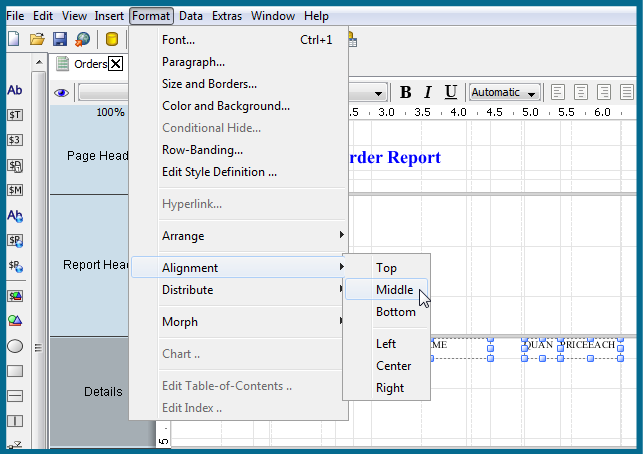
Alignment
To align multiple objects press SHIFTCLICK to select each object. Then, choose an alignment option from the
Format menu. Alternatively, you can click the Select
Objects icon ( ) and drag your mouse over the objects you want to select and then choose an
alignment option.
) and drag your mouse over the objects you want to select and then choose an
alignment option.
In the example below, the selected objects will be aligned in the middle of the band.