Set dashboard parameters

If you are placing a file, such as an .xaction or .prpt, inside a dashboard panel, it is possible that the author of the file defined meaningful parameters for the content. If previously defined, the parameters and their associated default values, appear under Parameters in the edit pane of the dashboard.
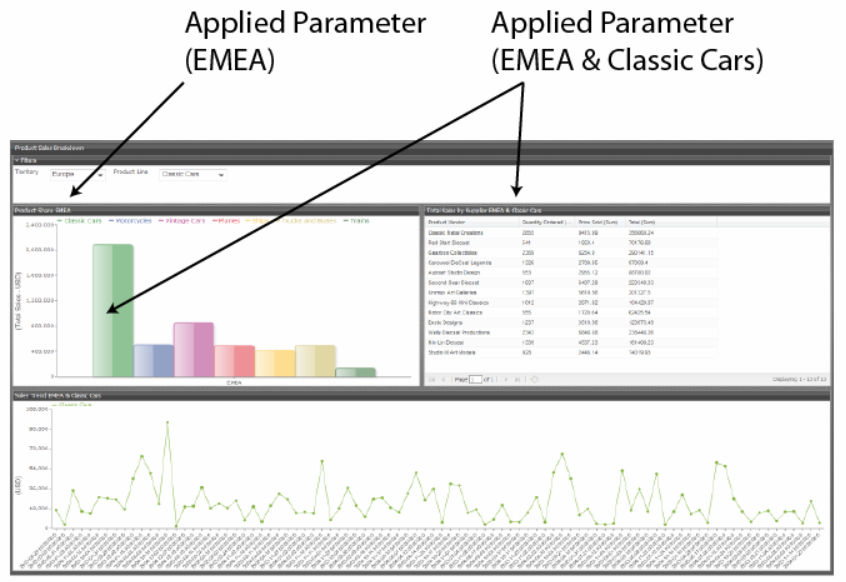
In the example in this article, when the chart initially rendered, it displayed a parameter called chart_type with a default value called bar. A user can change the value of the parameter to see the content rendered as a pie, line, or area chart.
Parameter names are hard-coded in the file, which means they cannot be changed. Neither can you change the number of parameters associated with a file. When you create a chart using the Chart Designer, embed a URL into a dashboard, or create a data table, you can change both the name and value of a parameter.
Getting started with the Query Editor
When you place a chart in a dashboard panel, you use the Query Editor to retrieve data from a database for display on your chart or data table. If applicable, you can add conditions or constraints that filter the data so that the chart or data table displays the information you want dashboard consumers to see.
Using parameters is critical if you plan on using dashboard prompts or linking content in
one dashboard panel to content on another dashboard panel. For example, suppose you create a
pie chart and you want to filter details associated with an exploded pie slice in the
adjoining data table as shown in the example below. In this instance, you must use a
parameter that allows the data table to update when a dashboard consumer clicks on a pie
slice. Optionally, you can parameterize the query condition so that the content is updated
based on a user interaction, such as changing a prompt value. 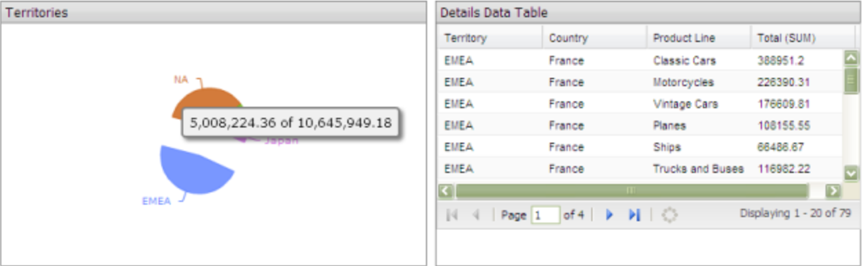
Creating chart or data table parameters
To create a parameter, in the
Value field, enter the name of the parameter inside curly braces,
as in {Parameter Name}. In the example below, the designer created a
parameter called {TERRITORY}; the default value, or source, for the
parameter is NA (North America). When a chart or data table
renders, it displays data associated with North America. Remember that this a default value.
When you enclose a parameter name with curly braces, you are creating a parameter
query, which means that users can change the query dynamically by replacing the
default value NA with a different territory acronym, (for
example, EMEA), when the query runs. 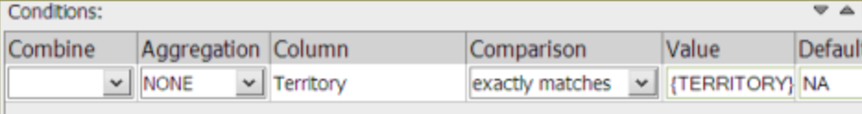
You can define multiple default parameter values by adding a pipe character (|) between the values, as in NA|EMEA|APAC.
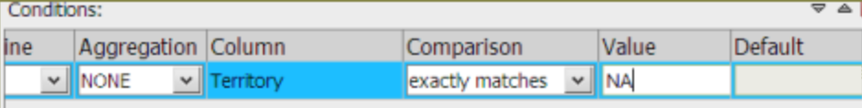
Suppose a dashboard designer chooses to limit the data to North America (NA) exclusively?
In this instance, he or she would not include the curly braces around
NA (as shown in the example below), and
Default (value) is disabled. This is an example of a static query.
Add dynamic dashboard titles
Procedure
Click the Edit (pencil) icon in the top toolbar.
The Edit pane appears at the bottom of the screen.Click the report that has the parameters you are going to change.
You will need to go through this process for each report to which you want to add parameters.Click the Add Parameter button.
Placed parameter appears after the title.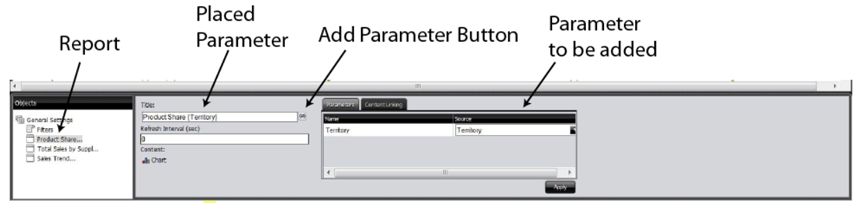
Click Apply.
Close the Edit pane by clicking the Edit (pencil) icon.
Results