Pentaho Interactive Reports

The intuitive, drag-and-drop, browser-based design environment for Interactive Reports enables you to quickly add elements to your report and format them any way you like. You do not need any special expertise to use Interactive Reports. You can also display Interactive Reports in a dashboard in the User Console.
Here is a list of the main Interactive Reports features.
- Drag-and-drop report design
- Font selection
- Column resizing
- Column sorting
- Ability to rename column headers
- Copy and paste functionality
- Unlimited undo and redo functionality
- Ability to output reports as HTML, PDF, CSV, Excel Workbook, or Excel 93-2003 Workbook files
- Ability to display reports in a dashboard
Before you can create Interactive Reports, you must have access to a data source. The data source for Interactive Reports is based on the Pentaho relational data model, also known as the metadata data model. This model enables the Pentaho system to present data in reports in meaningful business terms instead of in abstract terms. For example, a table referred to as CUST_TBLE or ORDR_TBLE in the data model can be presented in your report as Customers and Orders.
Get started with Pentaho Interactive Reports
Procedure
In the Folders pane, click to expand the Public folder, then click to highlight the Steel Wheels folder.
In the Files pane, click on Vendor Sales, and then click Edit in File Actions.
The Opened perspective appears with the Interactive Reports and toolbars active.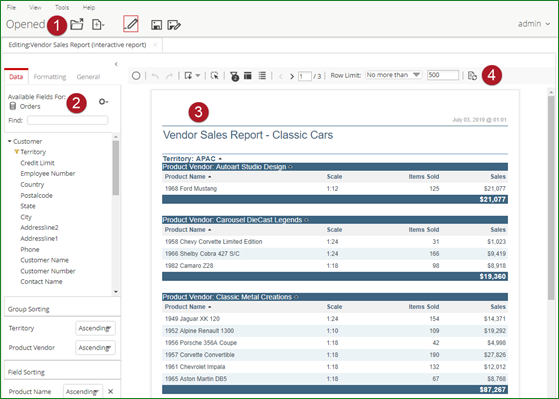
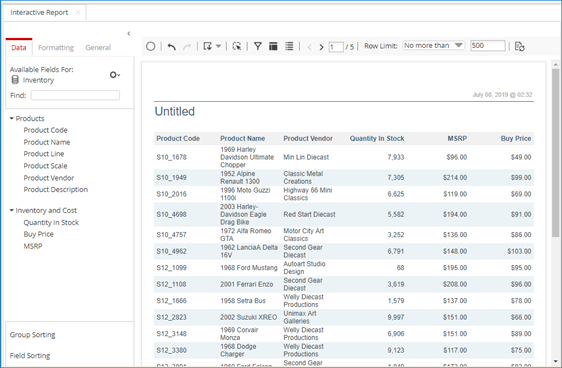
Item Name Function 1 Opened view Displays quick access buttons across the top to create and save new Analyzer reports, Interactive Reports, and Dashboard Designer reports. Opened reports and files show as a series of tabs across the page. 2 Data, Formatting, and General panels Use the Data panel to drag information into a column or a row on the report. Your report display changes as you drag items onto the Report Canvas. Use Find to search for a specific field.
Delete a level or measure from your report by dragging it from the Layout panel to the trash can that appears in the lower right corner of the Report panel.
The Formatting panel allows you to change the font size and type on the opened report.
The General panel allows you to set preferences, select a paper size for printing, and select from a variety of templates for your report.
3 Report canvas Shows a dynamic view of your Interactive report as you work to build it. The look of your report changes constantly as you work with Data, Formatting, and General panels to refine it. 4 Interactive toolbar and filters Use the toolbar functions to undo or redo actions, hide lists of fields, add or hide filters, disable the auto-refresh function, adjust settings, change the view of your report, and limit the number of rows queried. Use the filters panel to display a list of filters applied to the active report, or edit or delete filters.
Create an Interactive Report
Procedure
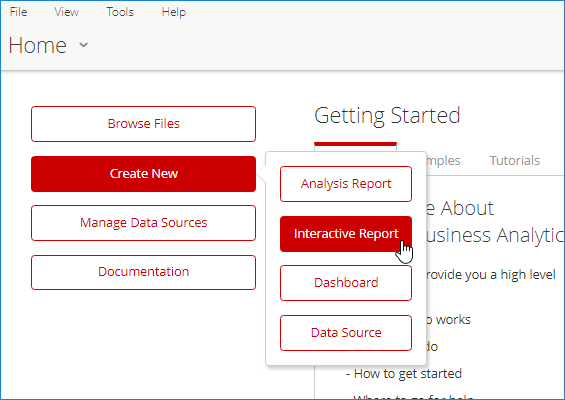
From User Console Home, click Create New, then Interactive Report.
Choose a data source for the report from the Select Data Source dialog box. Click OK.
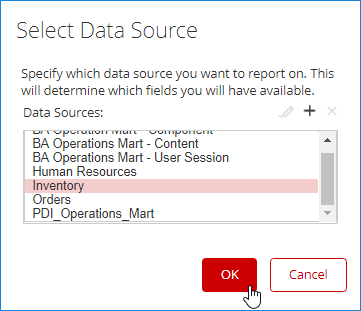 NoteIf no data source is listed in the dialog box, contact your administrator for help.
To add your first column, click and drag a field from the Data tab in the left panel.
Drag the field over the report canvas on the right until a vertical line appears, then drop the field in place. This field becomes a column in your report.
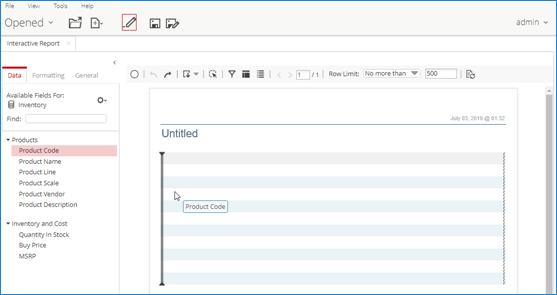
Continue to drag and drop fields on to the report canvas until you have all of the columns of your report in place.
You can rearrange the order of the columns by clicking on the headers and dragging the columns to the right or left of their current location. When a green line appears, you can drop the column there. You can also resize your columns by selecting the bar to the right or left of the column header and dragging it until your columns are the correct size.
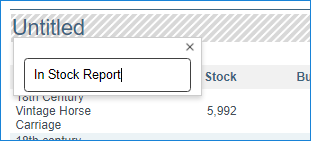
Rename your report by double-clicking on Untitled in the Report Canvas, and typing a name in the field that appears.
Click the Save As in the toolbar.
When the Save As dialog box appears, type a file name for your report, choose a location to save it in, and click Save.
Results
Edit your interactive report
Procedure
Log in to the User Console and click Browse Files to locate the folder containing your report.
Right-click the report name in the Files pane and choose Edit from the Folder Actions pane.
Alternatively, double-click the report name to open it, then click Edit in the User Console toolbar.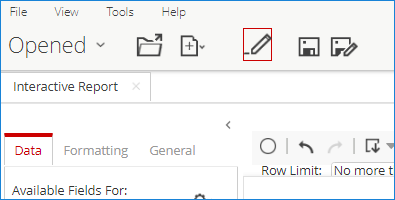
Edit your report as needed.
Save your report.
Customize an Interactive Report
Read and export in view-only mode
Hover your mouse over the icons in the toolbar to see which actions you can take. These actions include:
- Exporting a report as a PDF, HTML, CSV, Excel Workbook, or Excel 93 -
2003 Workbook file to be saved locally.
- You can also export a report in Edit mode.
- Adding filters for viewing report data.
- Rearranging the report layout, such as moving, sorting, and removing columns from the report.
You cannot save any changes to your report when you are in View-only mode. However, you can click Edit in the User Console toolbar to return to edit mode and save your changes.
Build large reports
If you are building Interactive Reports with a large amount of data, you might find that it is quicker to build the report if the data is not constantly refreshing or returning a large number of rows. You can manually refresh the report to view your results at any point in the process.
You can limit how often you query the data while building your report to help reduce the amount of time required to refresh the report. Use the options in the Query Settings dialog box to adjust refresh times while you are building your report.
- In the Data tab, click the Settings icon in the upper-right corner to open the Query Settings dialog box. Make changes as needed and close the dialog box when you are done.
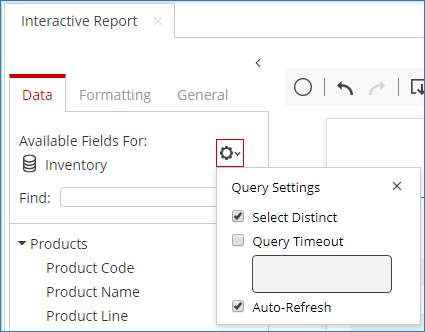
Distinct values
By default, Interactive Reports queries
data with the SQL SELECT DISTINCT statement when no GROUP
BY is used in the SQL query. This SQL statement returns only distinct (different) values, which may require an extensive sorting operation in
the database. To stop the query from returning distinct values, clear the Select
Distinct option in the Query Settings dialog
box. Your setting of the Select Distinct option is saved with your
report. For example, if you clear Select Distinct then save and close
your report, this option will be cleared when you reopen the report.
DISTINCT is a part of the SQL statement.Row limits and query timeouts
If you have exceeded the system maximum of rows, a help message appears to guide you.
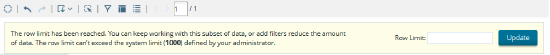
To define the system maximum row limit for your Interactive Reports, ask your system administrator to review the Customize the Pentaho Server article.
Auto refresh mode
Advanced topics
- Group and Filter Data in Interactive Reports
You can group data in your Interactive Reports so that related items appear together.
- Create advanced filters in Interactive Reports
You can create filters on multiple groups of fields, rather than a single group of fields.