CDE advanced solutions

CTools and RequireJS
You can include RequireJS support when creating your Community Dashboard Editor (CDE) dashboards. RequireJS is a JavaScript file and module loader which may improve the speed and performance of your dashboards.
Enable RequireJS support
To include RequireJS, in the Settings dialog box, select the RequireJS Support check box when you save a dashboard.

Architectural considerations for including RequireJS
Including RequireJS in CTools required several architectural changes, such as using Asynchronous Module Definition (AMD) for JavaScript modules.
Specifically, the following changes were made:
Most of the methods called in Dashboards are available elsewhere. If you are running code in the component context (meaning that this refers to a component), like in preExecution, postExecution and postFetch, most methods will be available in the this.dashboard. Some exceptions exist:
- The logging methods were migrated to a separate AMD module with ID cdf/Logger, so Dashboards.log has been replaced with Logger.log.
- Some static methods were migrated to a separate AMD module with ID cdf/dashboard/Utils, such that
- Dashboards.escapeHtml is now Utils.escapeHtml.
- Dashboards.getQueryParameter is now Utils.getQueryParameter.
- Dashboards.objectToPropertiesArray is now Utils.objectToPropertiesArray.
- Dashboards.propertiesArrayToObject is now Utils.propertiesArrayToObject.
Instead, components and parameters are internal to the dashboard. If you want to get to a component, you need to use the getComponent method in the dashboardobject. For parameters, always use the getParameter method.
When debugging during dashboard development, follow the same guideline. If you have a component called foo, then the object render_foo is no longer accessible from the console. Instead, call dashboard.getComponent ("render_foo") to get to that component. When CDE renders, it creates a dashboard object in the global scope. It is recommended that you use the dashboard object to access the dashboard internals you need. You can view further information on RequireJS in CTools Dashboards.
Create a dashboard using RequireJS
In this walk-through tutorial, you will create a CTools dashboard using RequireJS. These instructions assume that you are familiar with the main features in CDE and the basic steps of creating a dashboard in CDE. In addition, these instructions assume that you have activated the CDE plugin.
The process is broken down into six basic steps.
Step 1: Set up folders in User Console and create the dashboard
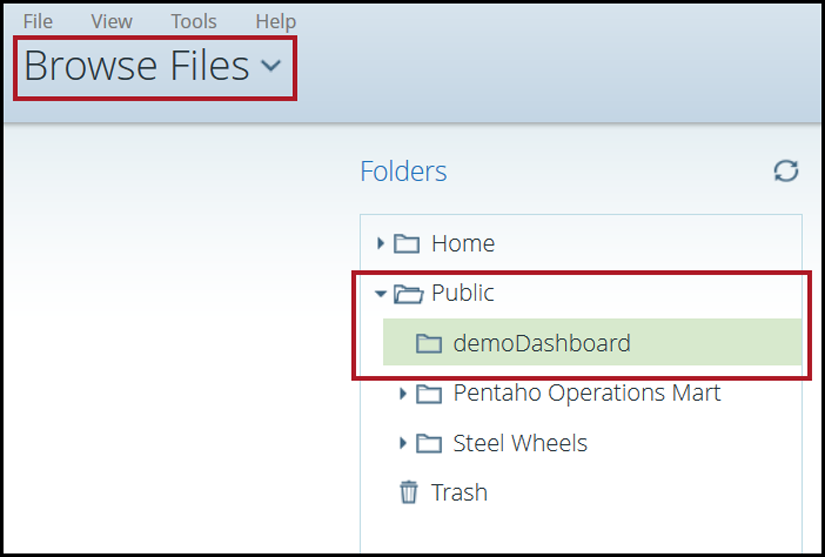
Log on to the User Console and navigate to the Browse Files perspective.
In the Folders pane, click on the Public folder and then, in the Folder Actions pane, click New Folder. Create a solutions folder called demoDashboard.
Expand the Public folder and click on the newly created demoDashboard folder. In the Folder Actions pane, click New Folder and create a subfolder titled files which will contain the JavaScript and Cascading Style Sheets (CSS) files used in this dashboard.
Open CDE and create a new dashboard titled demoDashboard, and save it in the folder you just created.
From the CDE menu bar, click Settings, and then select the RequireJS Support check box to convert the dashboard to a RequireJS dashboard.
Click Ok.
A message box appears warning you about possible issues with your custom JavaScript code in your dashboard. Click Ok to proceed. The dashboard is now saved as a RequireJS dashboard.
Step 2: Add layout
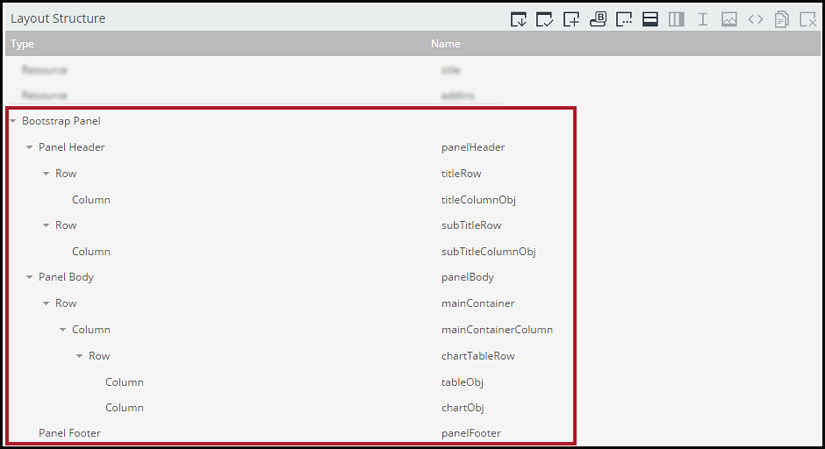
From the Layout Structure menu bar, click the Add Bootstrap Panel button.

Configure your bootstrap panel to match the settings in the image below. Be sure to add and rename all displayed rows and columns.
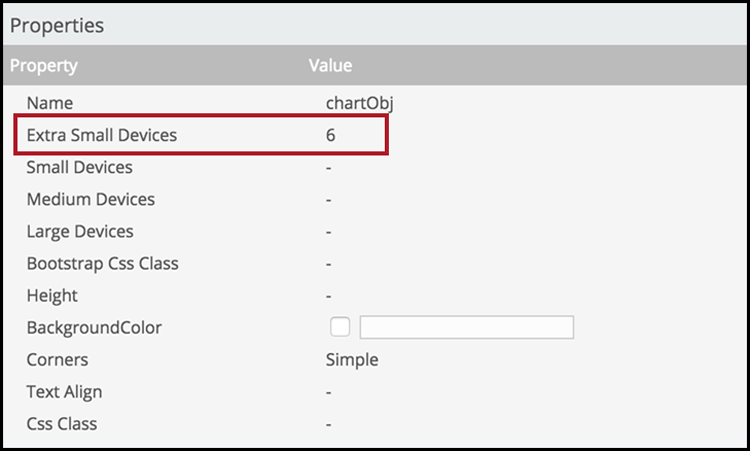
In the Properties pane, all columns by default set the Extra Small Devices property to 12 spans. Change the Value for the following columns:
- Set tableObj and chartObj to 6 spans.
See CDE dashboard overview for more information on Bootstrap in CDE.
Center the title and subtitle in the Properties pane.
For both titleColumnObj and subTitleColumnObj, locate the Text Align property and click in the Value column. On the keyboard, press the down arrow to display a drop-down menu and select Center.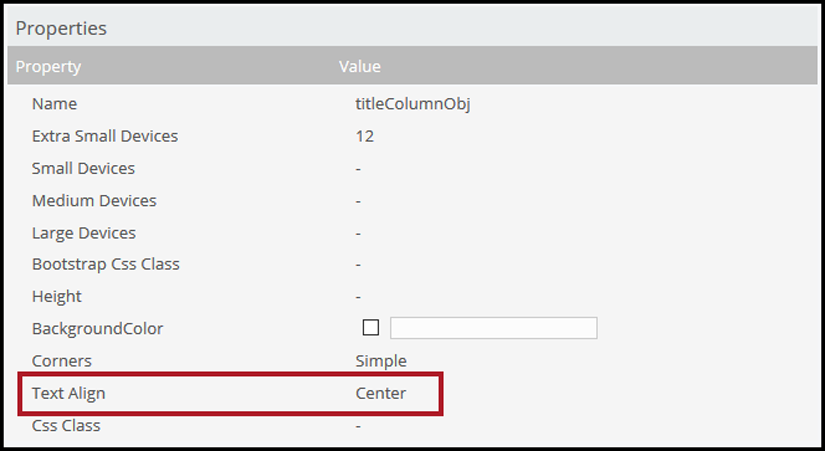
Step 3: Add external resources
In the CDE Layout perspective, on the Layout Structure toolbar, click the Add Resource icon.

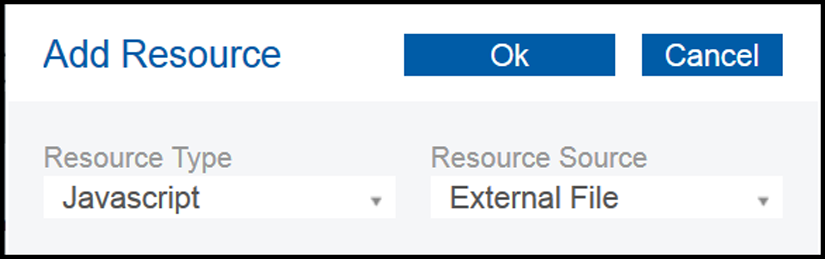
In the Add Resource dialog box, enter the following data:
- For Resource Type, select Javascript.
- For Resource Source, select External File. Click Ok.
In the Properties pane, click in the Value column to the right of the Name property and enter addins. Press Tab or Enter.
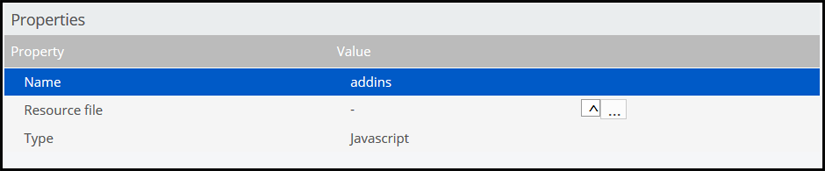
Click the caret ('^') button to the right of the Resource file property and navigate to . Click Ok.
In the Create File dialog box, enter addins and click Ok.
You have now created the addins.js file, which will contain the JavaScript code to execute within the dashboard components. Note that the name you give to the JS file is how the file itself will be referenced within the dashboard.To enter content in the addins.js file, select the addins resource in the Layout Structure pane. Locate the Resource file property and click the ellipse ('...') button to open the Edit window. Enter the following content for this file:
define([ "cdf/AddIn", "cdf/Dashboard.Clean", "cdf/Logger", "cdf/lib/jquery" ], function(AddIn, Dashboard, Logger, $) { Dashboard.registerGlobalAddIn("Table", "colType", new AddIn({ name: "customArrow", label: "customArrow", defaults: {}, implementation: function(tgt, st, opt) { if(typeof st.value !== "number") { Logger.warn("customArrow add-in invalid value: " + st.value); return; } var trend = st.value > 0 ? "up" : "down"; $(tgt).empty() .append($('<ul><span class="glyphicon glyphicon-arrow-' + trend +'"></span> <span>'+ st.value +'%'+'</span></ul>')); } })); });- Lines 2 to 5 specify the dependencies needed for the add-in, which are then registered for use in the function.
- Line 7 registers the add-in, which is then available to the table component.
Press the Save button and then press the Close button.
Following steps 2 through 5, add a second JavaScript external resource named title and save a new file named title.js in the folder. The dashboard will have a title and a subtitle which are provided by the text components created in Step Five. These components will fetch the displayed value from an object returned by the AMD module defined in the title.js file.
To enter content in the title.js file, in the Layout Structure pane select the title resource and then select the Resource file property. Click the ellipse ('...') button to open the Edit window. Enter the following content for this file:
define(function() {
  return {
    option1: 'CDE Dashboard',
    option2: 'Using a Table with a custom add-in and a CCC Bar Chart',
  };
});
In this file, an AMD module is defined which returns an object with two properties. This object will be accessible to the text components, using the same name as the one used for the Name property of the JavaScript external resource, and its properties will be used as the title and subtitle.
Press the Save button and then press the Close button.
Step 4: Add data sources
Procedure
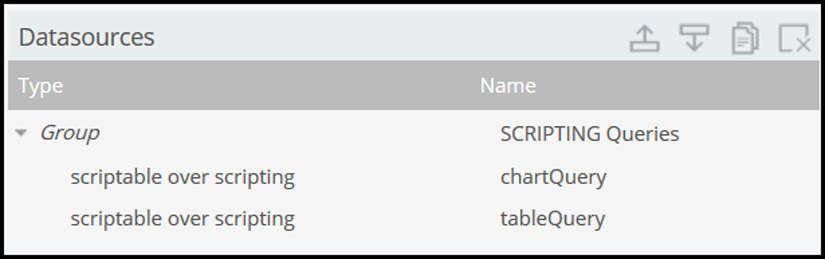
In the Data Source perspective, from the Data Source list, click SCRIPTING Queries, and then click scriptable over scripting twice.
In the Datasources panel, in the Name column, enter chartQuery for the first data source, and tableQuery for the second.
Add the following script to the Query property for the chartQuery data source:
import org.pentaho.reporting.engine.classic.core.util.TypedTableModel;
String[] columnNames = new String[]{
  "Country", "Population growth per City [%]"
};
Class[] columnTypes = new Class[]{
  String.class, Float.class
};
TypedTableModel model = new TypedTableModel(columnNames, columnTypes);
model.addRow(new Object[]{
  new String("Tokyo"), new Float("60")
});
model.addRow(new Object[]{
  new String("Nice"), new Float("20")
});
model.addRow(new Object[]{
  new String("London"), new Float("-10")
});
model.addRow(new Object[]{
  new String("Munich"), new Float("30")
});
model.addRow(new Object[]{
  new String("Porto"), new Float("10")
});
model.addRow(new Object[]{
  new String("Brasilia"), new Float("10")
});

return model;
Add the following script to the Query property for the tableQuery data source:
import org.pentaho.reporting.engine.classic.core.util.TypedTableModel;
String[] columnNames = new String[]{
  "Country", "City", "Population growth per City"
};
Class[] columnTypes = new Class[]{
  String.class, String.class, Float.class
};
TypedTableModel model = new TypedTableModel(columnNames, columnTypes);
model.addRow(new Object[]{
  new String("Japan"), new String("Tokyo"), new Float("60")
});
model.addRow(new Object[]{
  new String("France"), new String("Nice"), new Float("20")
});
model.addRow(new Object[]{
  new String("UK"), new String("London"), new Float("-10")
});
model.addRow(new Object[]{
  new String("Germany"), new String("Munich"), new Float("30")
});
model.addRow(new Object[]{
  new String("Portugal"), new String("Porto"), new Float("10")
});
model.addRow(new Object[]{
  new String("Brazil"), new String("Brasilia"), new Float("10")
});

return model;
Step 5: Add components
Switch to the Components perspective.
From the Components list, expand the appropriate Group section, and then add the following components to the dashboard with the specified Name and HtmlObject properties in the table below. (See Customize the Components Perspective for more detailed instruction.)
Group Component Name HtmlObject Others Text Component subTitleComponent subTitleColumnObj Others Text Component titleComponent titleColumnObj Others table Component tableComponent tableObj Charts CCC Bar Chart chartComponent chartObj 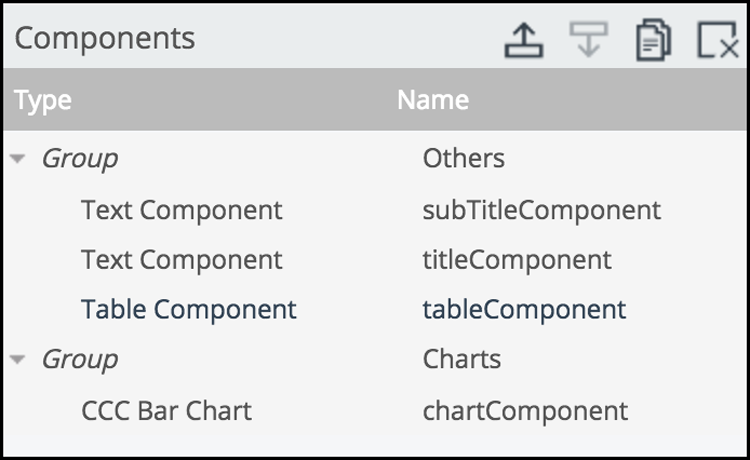
Set the width and height for the chartComponent bar chart.
- Click in the Value column for the Height property and type 450. Press Tab or Enter.
- Click in the Value column for the Width property and type 400. Press Tab or Enter.
Set the titleComponent text component by adding the following code to the Expression property:
function f() {
  return "<strong>" + title.option1 + "</strong>";
}
This piece of code is returning the content of option1 defined in the title.js file in Step Three.
Set the subTitleComponent text component by adding the following code to the Expression property. Note that this code is similar to the previous step, substituting
option2foroption1:function f() { return title.option2; }In the tableComponent component, set the Column Types property as follows:
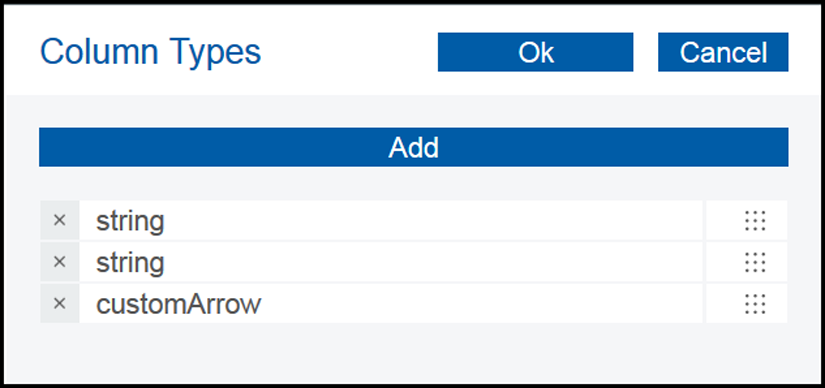
Notice that the third line in the table is using the non-standard customArrow add-in. It is now available because it was registered earlier using the addins.js JavaScript external resource file.
Set the Datasource property for the tableComponent to use the tableQuery data source created earlier in Step Four.
Set the Datasource property for the chartComponent to use the chartQuery data source created earlier in Step Four.
Step 6: Preview the dashboard
Save your dashboard and click the Preview your Dashboard icon in the top-right corner.
The Preview window displays.Inspect your dashboard.
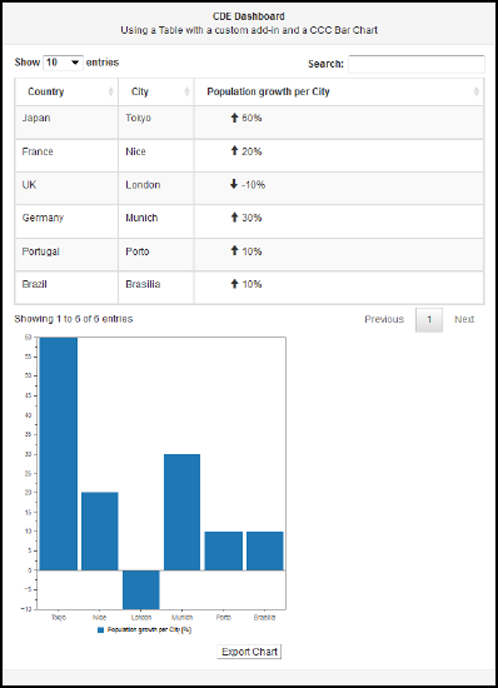
Your finished dashboard should look similar to the image below.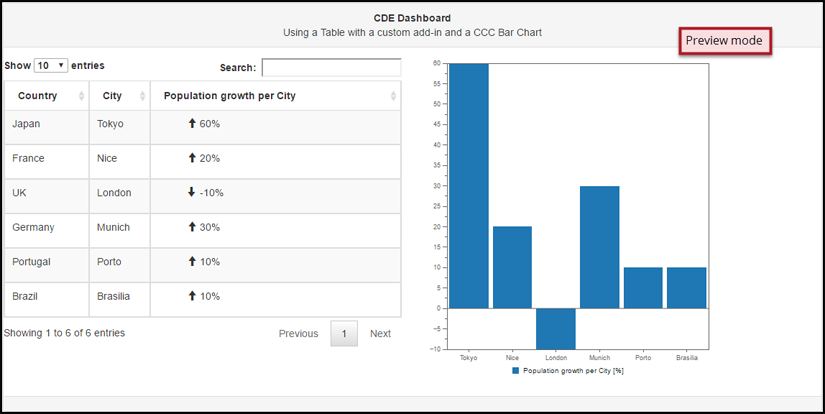
When finished, close the Preview window.
Embedding dashboards built with RequireJS
You can embed a RequireJS dashboard as a sub-dashboard in an application without saving it as a widget. This direct method of embedding sub-dashboards into a main dashboard avoids possible conflicts from mismatching libraries which can occur when using widgets. With RequireJS, you no longer need to use widgets to embed sub-dashboards into an application.
In this tutorial, you will learn how to embed the dashboard within Pentaho Server or embed the dashboard using a server other than Pentaho. These instructions assume that you are familiar with the main features in CDE and the basic steps of creating a dashboard in CDE. In addition, these instructions assume that you have activated the CDE plugin.
Embedding within Pentaho Server
Procedure
On your Desktop, create a folder named Embed to hold the three files we will create and upload to the Pentaho Server in this tutorial:
- main.html
- includeDashboards.js
- styles.css
Use a text editor to create a new HTML file and save it as main.html in the Embed folder you just created. Copy the following HTML code to the file:
<!DOCTYPE html> <html> <head> <meta http-equiv="content-type" content="text/html; charset=utf-8"/> <title>Embedding CDE Dashboards with RequireJS</title> <link rel="stylesheet" type="text/css" href="../../repo/files/:public:Embed:styles.css"/> <script type="text/javascript" src="../../../plugin/pentaho-cdf-dd/api/renderer/cde-embed.js"></script> </head> <body> <div class="headerContainer"> <header class="header"> <a class="logo" href="http://www.pentaho.com/"> <img src="http://www.pentaho.com/sites/all/themes/pentaho_resp/_media/logo-pentaho-new.svg" alt="Pentaho Logo"> </a> <div class="titleHTML"> <strong>Embedding CDE Dashboards with RequireJS</strong> </div> </header> </div> <div class="dashboardContainer"> <div id="content1"></div> <div id="content2"></div> <script src="../../repo/files/:public:Embed:includeDashboards.js"></script> </div> </body> </html>- Line 7 loads the cde-embed.js resource, which contains all the RequireJS configurations to embed CDE dashboards into the HTML page.
- Line 20 creates a div which contains two other divs, identified as
content1andcontent2, in which two instances of the required dashboard class will be rendered. - Line 23 loads the includeDashboards.js file, which uses RequireJS to load the demoDashboard CDE dashboard as a JavaScript class. This file creates both instances and associates each one to its respective div and executes its render function.
Create the includeDashboards.js file and save it in the Embed folder. Copy the following JS code to the file:
require([ "dash!/public/demoDashboard/demoDashboard.wcdf" ], function(SampleDash) { // Create two instances of the same dashboard that use distinct DOM elements (new SampleDash("content1")).render(); (new SampleDash("content2")).render(); });- The CDE dashboard is obtained via the CDE endpoint,
/pentaho/plugin/pentaho-cdf-dd/api/renderer/getDashboard. The
path field in the query string must contain the path to the CDE dashboard. Below is an
example.
require([ "/pentaho/plugin/pentaho-cdf-dd/api/renderer/getDashboard?path=/public/demoDashboard/demoDashboard.wcdf" ], function(SampleDash) { /* code */ }); - This endpoint returns a RequireJS module which contains a class for a specific
dashboard which is used to create new dashboard instances. You can also embed a
dashboard using the simpler dash! RequireJS loader plugin, such as in the
includeDashboards.js source code. Below is an
example.
require([
  "dash!/public/demoDashboard/demoDashboard.wcdf"
], function(SampleDash) { /* code */ });
- The CDE dashboard is obtained via the CDE endpoint,
/pentaho/plugin/pentaho-cdf-dd/api/renderer/getDashboard. The
path field in the query string must contain the path to the CDE dashboard. Below is an
example.
Create the styles.css file in the Embed folder. Copy the following CSS code to the file:
body {
  padding: 10px;
}

img {
  width: 300px;
  padding-bottom: 10px;
}
Zip the Embed folder, and then use PUC to upload the compressed folder to the Pentaho Server’s Public folder.
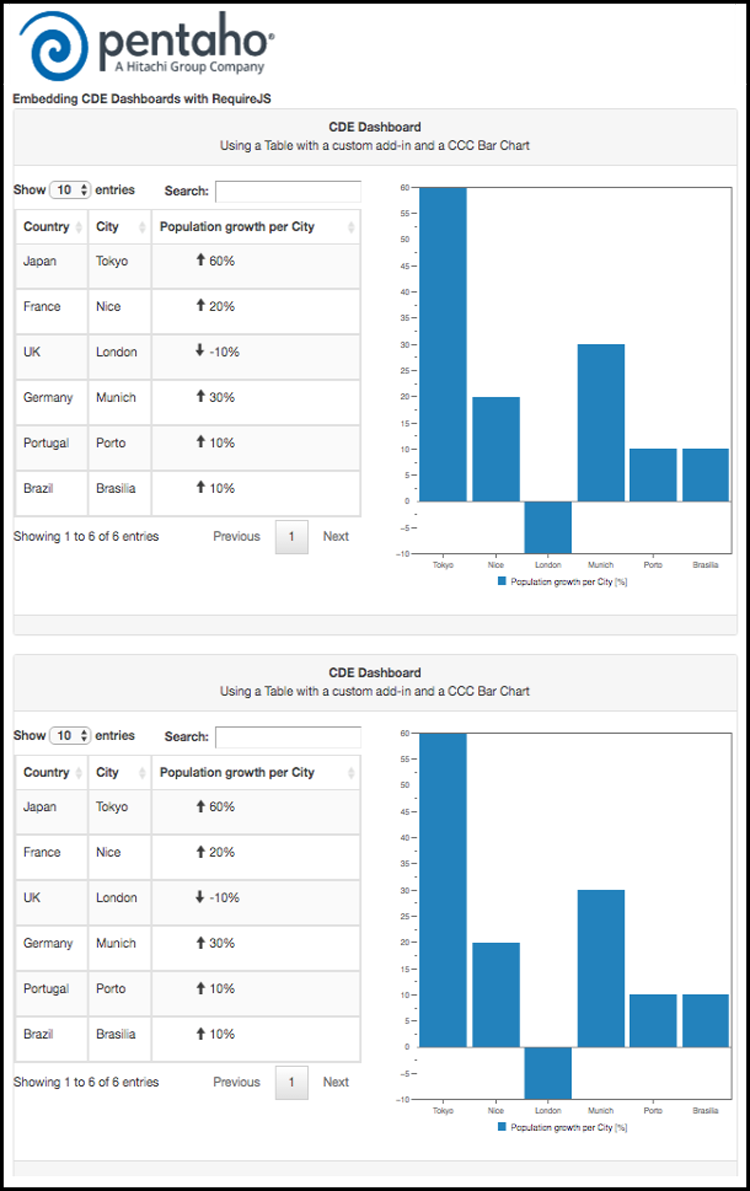
Finally, review your work. From the folder, open the main.html file. The embedded dashboard should look similar to the image below.
Embedding in a server other than Pentaho
In this walk-through tutorial, you will embed the dashboard created in the Create a dashboard using RequireJS tutorial into an HTML page running on a server that is not the Pentaho Server. This process requires the following steps:
- Save the embed folder.
- Edit the settings XML files.
- Edit the Pentaho XML file.
- Edit the main XML file.
- Access the embedded dashboard.
Step 1: save the embed folder
If you have not done so already, save the Embed folder from the previous tutorial to your Desktop.
Step 2: edit the settings XML files
- For CDF: server/pentaho-server/pentaho-solutions/system/pentaho-cdf/settings.xml.
- For CDE: server/pentaho-server/pentaho-solutions/system/pentaho-cdf-dd/settings.xml.
- For CDA: server/pentaho-server/pentaho-solutions/system/cda/settings.xml.
Make the following replacements in each settings.xml file:
Procedure
In all settings.xml files, find the line:
<allow-cross-domain-resources>false</allow-cross-domain-resources>
and then change it to:<allow-cross-domain-resources>true</allow-cross-domain-resources>
In the settings.xml file for CDF and CDA, find the line:
<cross-domain-resources-whitelist><!--intentionally left blank --></cross-domain-resources-whitelist>
and then change it to:<cross-domain-resources-whitelist>http://localhost:2777</cross-domain-resources-whitelist
Step 3: edit the Pentaho XML file
Procedure
Find the line:
<cors-request-allowed>false</cors-request-allowed>
and then change it to:<cors-request-allowed>true</cors-request-allowed>
Find the line:
<cors-requests-allowed-domains><!-- allowed domains here --></cors-requests-allowed-domains>
and then change it to:<cors-requests-allowed-domains>http://localhost:2777</cors-requests-allowed-domains>
Step 4: edit the main HTML file
Procedure
Replace lines 6 and 7 with the three lines of code below. This example assumes the Pentaho Server is running locally on host localhost port 8080.
<link rel="stylesheet" type="text/css" href="styles.css"/>
<link rel="stylesheet" type="text/css" href="http://maxcdn.bootstrapcdn.com/bootstrap/3.1.1/css/bootstrap.min.css"/>
<script type="text/javascript" src="http://localhost:8080/pentaho/plugin/pentaho-cdf-dd/api/renderer/cde-embed.js"></script>
NoteAdding the Bootstrap link tag minimizes the risk that the arrow images will fail to load, which may result when using CORS and font-fetching in CSS files. Updating the HTML script tag allows the cde-embed.js resource to be loaded from the correct location.Replace line 24 with the following line of code:
<script src="includeDashboards.js"></script>
Step 5: access the embedded dashboard
Procedure
Stop and restart the Pentaho Server.
Since Python 3 is being used in this tutorial, open a shell or terminal and navigate to the Embed folder directory.
Start a local HTTP server on localhost port 2777 by issuing the following Python command:
python -m http.server 2777
Access the dashboard via the URL http://localhost:2777/main.html. After logging in using your Pentaho credentials, you should have access to the following content:
Exporting charts
In this tutorial, you will learn how to export charts. These instructions assume that you are familiar with the main features in CDE and the basic steps of creating a dashboard in CDE. In addition, these instructions assume that you have activated the CDE plugin.
Exporting charts with CGG
Procedure
Open the demoDashboard in CDE.
Log on to Pentaho User Console and navigate to the Browse Files perspective.
In the Folders pane, click to expand the Public folder, and then click to highlight the demoDashboard folder.
In the Files pane, click on demoDashboard and then, in the File Actions pane, click Edit.
You are now in the Opened perspective with CDE in editing mode. The Editing:demoDashboard tab is now active in CDE.
In the Components perspective, press ShiftG. In the Choose what charts to render as CGG popup, click to select the chartComponent check box.
This popup lists all the components available to CGG, such as the Community Charting Components (CCC) chart components. When you save the dashboard, CGG generates a JavaScript file for each chart selected in the popup and saves it in your solutions directory.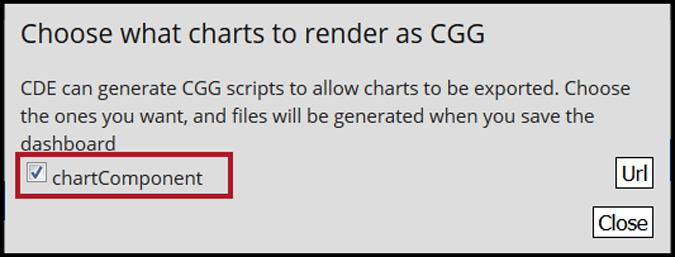
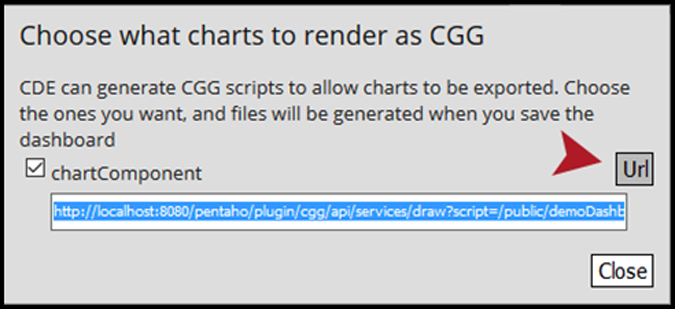
Click the Url button to generate a URL link to CGG which will export the target chart image. Copy the export link by selecting the full URL text and pressing CtrlC on your keyboard. When finished, click Close.
Before we can use the export URL, we need to save the dashboard so the CGG scripts are generated and saved in the proper repository. To save the dashboard, on the CDE menu bar, click Save.
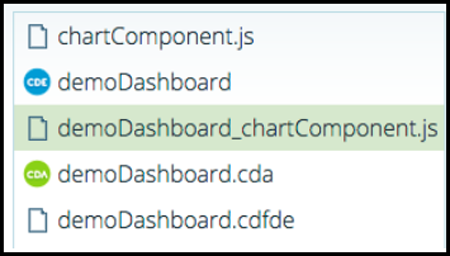
View the generated CGG JavaScript files. In Pentaho User Console, navigate to your demoDashboard folder. Note the following files:
- The demoDashboard_chartComponent.js contains the chart definitions.
- The chartComponent.js contains the same content as the above file. This file is saved for backwards compatibility with previous server versions.
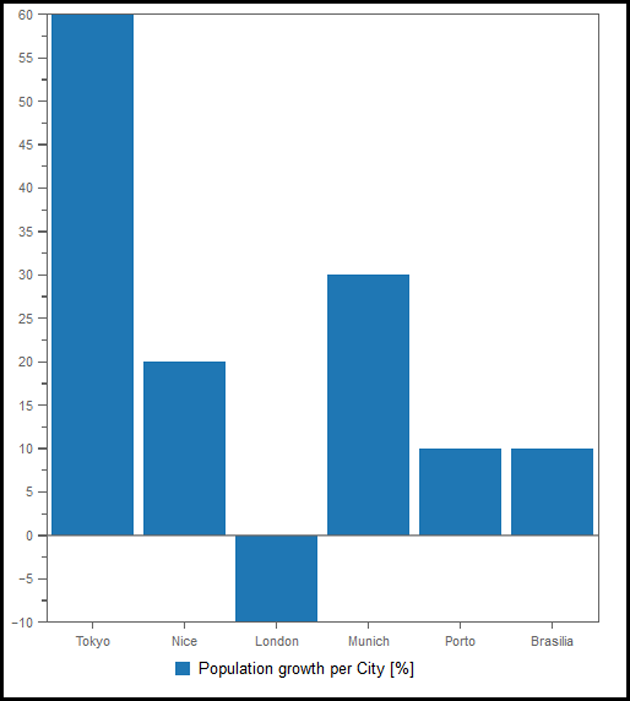
Open a browser window and paste the export URL (from Step 3) into the browser's navigation bar. Press Enter. The chart image displays in the browser window.
Next steps
http://localhost:8080/pentaho/plugin/cgg/api/services/draw?script=/public/demoDashboard/demoDashboard_chartComponent.js&outputType=svgExporting charts from a dashboard
Procedure
Open the demoDashboard in CDE.
(For detailed instructions, see Step 1 in Exporting Charts with CGG.)Customize the layout for the export button.
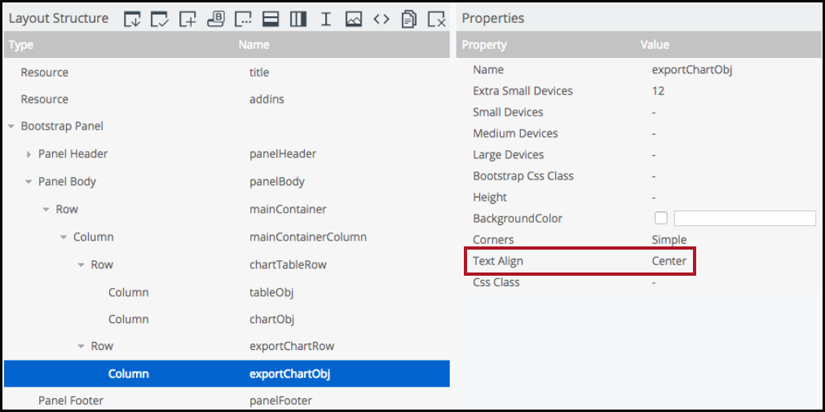
In the Layout perspective, locate the mainContainerColumn column and add a row named exportChartRow.
Select the exportChartRow and add a column named exportChartObj.
Select the exportChartObj column and in the Properties pane, locate the Text Align property and set its value to Center.
Add and customize the export button.
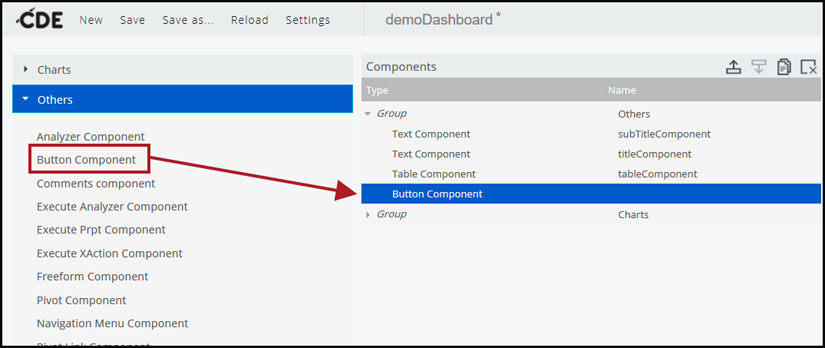
In the Components perspective, in the left menu, expand the Others group and click on the Button Component.
In the Components pane, select the Button Component you just added. In the Properties pane, set the following values:
Property Value Name exportChart Label Export Chart HtmlObject exportChartObj
Copy the following code to the Expression property:
function f() { this.dashboard .getComponentByName('render_chartComponent') .exportChart('png'); }NoteThis code allows you to retrieve the chartComponent component via the dashboard and execute its exportChart function by passing it the png parameter which defines the export file type as a PNG file.When completed, the Properties pane should look similar to the image below.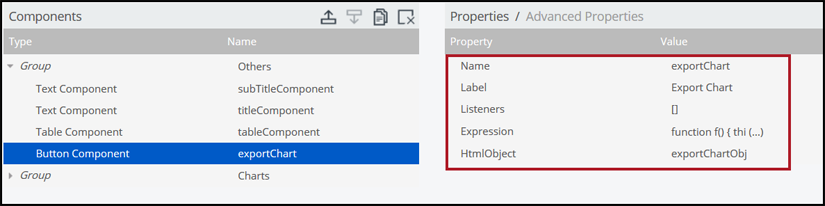
In the Components perspective, press ShiftG to display the Choose what charts to render as CGG popup. Make sure the chartComponent check box is selected, then click Close.
After saving the dashboard, return to Pentaho User Console, navigate to the Browse Files perspective and double-click the demoDashboard file. The following chart displays:
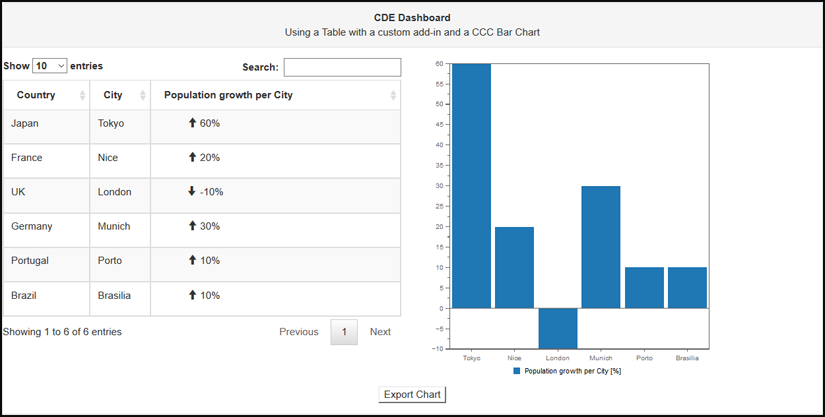
Press the Export Chart button to download the chart file as a PNG file.
Building responsive dashboards
Before you begin
Procedure
Open the demoDashboard in CDE.
For detailed instructions, see Step 1 in Exporting Charts with CGG.In the Layout perspective, locate and expand the chartTableRow row.
Select the tableObj column and in the Properties pane, set the Medium Devices property to 6 spans. Additionally, set the Extra Small Devices property to 12 spans.
Select the chartObj column and in the Properties pane, set the Medium Devices property to 6 spans. Additionally, set the Extra Small Devices property to 12 spans.
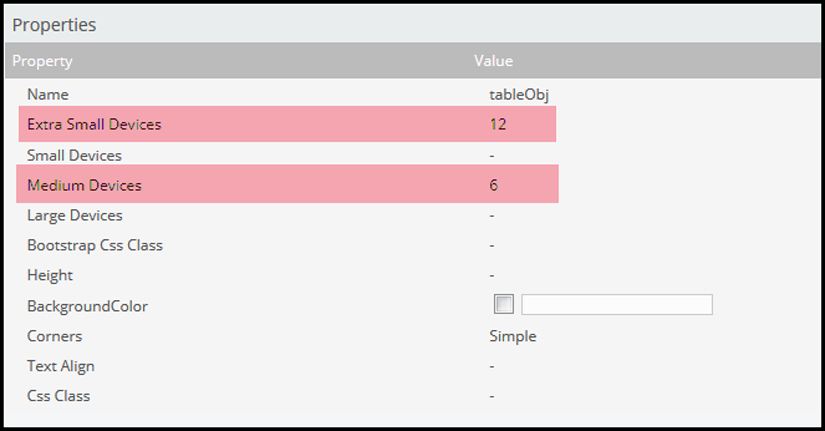 NoteThe Small Devices property will inherit its value from the Extra Small Devices property, and the Large Devices property will inherit its value from the Medium Devices property. For more information about how Bootstrap works in CDE, see the CDE Dashboard Overview.
Save the demoDashboard.
In Pentaho User Console, navigate to the Browse Files perspective and double-click the demoDashboard file. When rendered, the dashboard will look similar to the following:
To test the responsiveness of your dashboard, reduce the size of your browser window. The dashboard layout will respond accordingly: