Visualization API

The Visualization API 3.0 provides a unified way to visualize data across the Pentaho suite, including Analyzer, PDI, and CDF. This API allows for safe and isolated operation between third party applications, visualizations, and business logic.
The Visualization API 3.0 is built on top of the following Pentaho Platform JavaScript APIs:
provides seamless integration with data sources in the Pentaho platform, as well as with other client-side component frameworks.
Provides out-of-the-box features such as class inheritance, metadata support, validation, and serialization.
Provide underlying core features such as localization, theming and services registration, and consumption.
A set of stock visualizations is included to cover the most common chart types. Based on the CCC charting library, these stock visualizations are customizable and extensible to fit your organization’s desired look and feel.
If you want to know more about the specifics of how Analyzer integrates with the Visualization API, see Analyzer and the Visualization API.
The following sections will guide you through a sample visualization for the Pentaho platform.
Creating a visualization
You create a visualization by defining the following classes:
Modelclassidentifies the visualization and defines it in terms of its data requirements, such as the visual degrees of freedom it has (x position, color, and size for example) and any major options that affect its rendering.
IViewclassimplements the actual rendering using chosen technologies, such as HTML, SVG, D3, and handles user interaction by dispatching actions including selection, drilling-down, and showing a tooltip.
The D3 bar chart sample project is provided as an example of a custom
visualization. It uses a Model class and an IView class
created from a third party (D3.js) chart. You can get and build the D3 bar chart sample
project by using the following example code:
# Clone the repository.
git clone https://github.com/pentaho/pentaho-engineering-samples
cd pentaho-engineering-samples
git checkout -b 8.3

# Go to the complete sample's directory.
cd Samples_for_Extending_Pentaho/javascript-apis/platform/visual-samples-bar-d3

# Install the dependencies.
npm install

# Package your files.
npm pack
Deploying the visualization
To deploy the sample D3 bar chart visualization to a Pentaho product, such as thePentaho Server or PDI, copy the TGZ file into the system/karaf/deploy folder.
After deploying the sample project, the sample D3 bar chart visualization now appears in Analyzer and PDI. It is also available in a CDE dashboard.
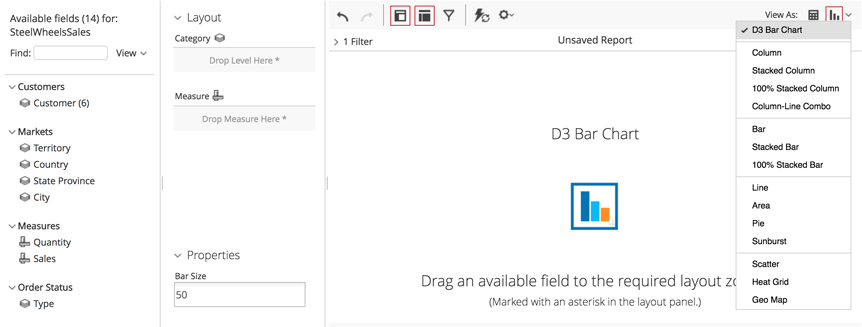
- In Analyzer, the
D3 bar chart visualization menu and placeholder icon appear on the canvas:
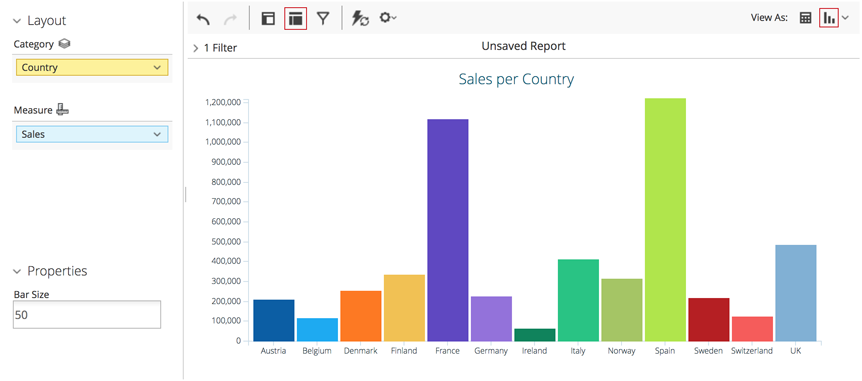
- The D3 bar chart visualization fully renders in Analyzer:
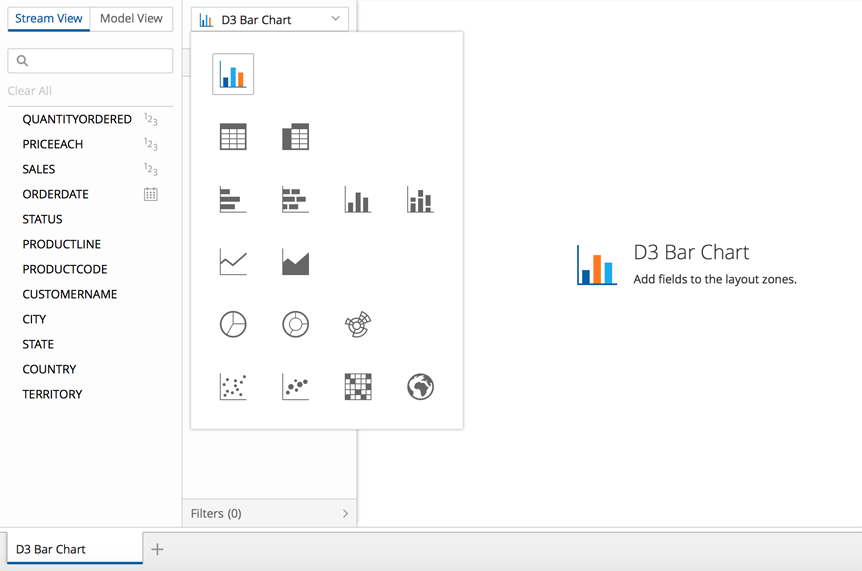
- In PDI, the D3 bar chart visualization menu and placeholder icon appear on the
canvas:
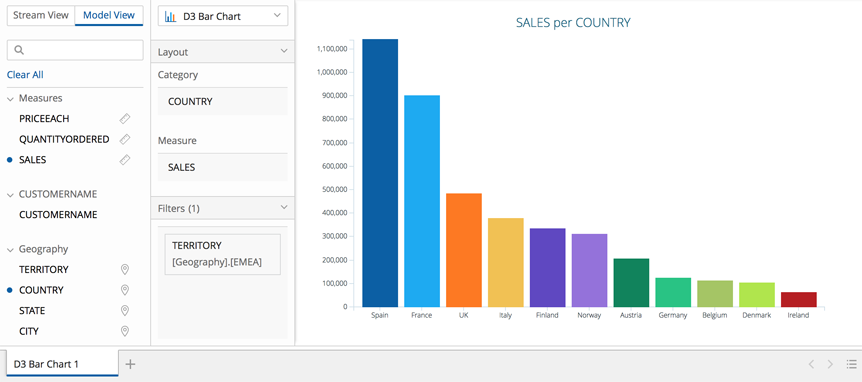
- The D3 bar chart visualization fully renders in PDI:
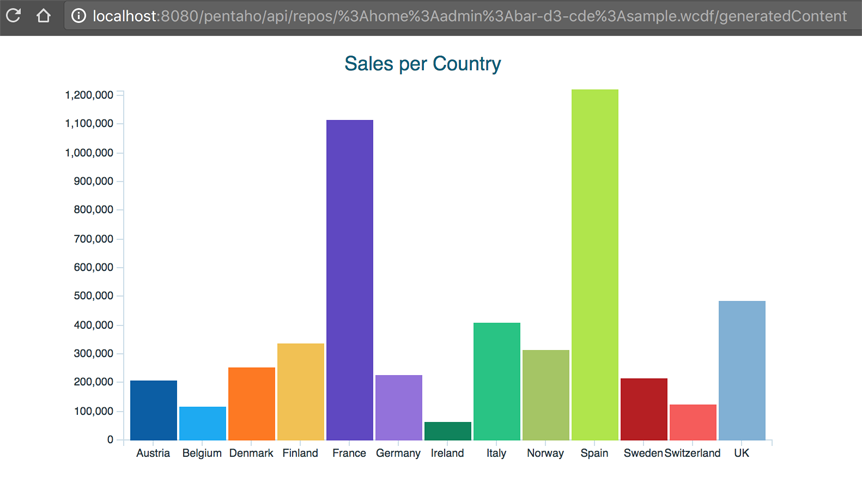
- In CTools, the
D3 bar chart is available for use in a dashboard. You can obtain the following dashboard
from the pentaho/pentaho-engineering-samples
directory:
Configuring the visualization
A visualization can be configured by third parties using configuration rules in external configuration files. These configurations are merged with any default configuration included with the visualization.
See Configuring a visualization for more information.