Set Analyzer report options

In your report, you can modify how blank measures display, define drill-through columns, and show or hide totals for columns and rows.
To open the Report Options dialog box, select the More
actions and options button, and then click Report
Options.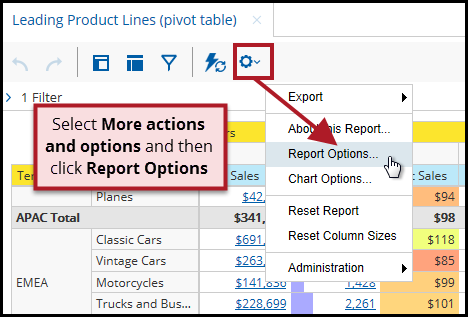
Working with rows where the number cell is blank
Blank cells are values in your report which are
null or empty. You can control how to display a blank value in a field. You can also create a
few rules for when to show rows or columns containing blank values.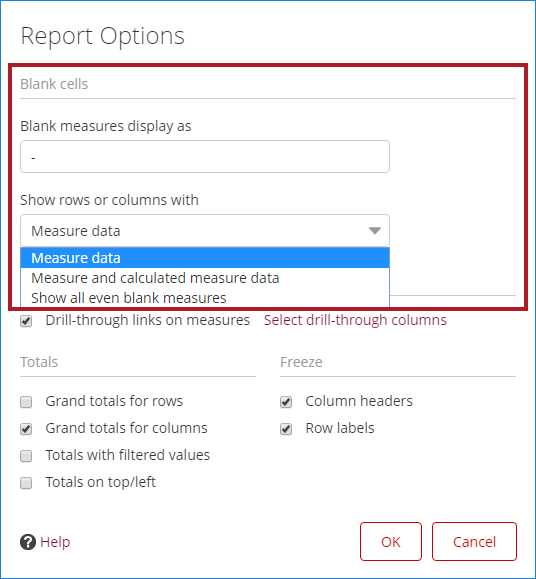
Set blank measure display
You can control what to show when a cell contains a blank value in your Analyzer report. Analyzer reports are designed to break down number fields, such as 'Sales', by text fields such as 'Product Name'. If a product did not sell, it will appear either as zero dollars or as a blank or a dash ("-"). In some reporting situations, the absence of a value could mean the same as a zero, but in other cases, zero might have a different meaning. The report calculations in the background behave differently depending on whether a value is 'blank' or a 'zero'. For example, when the report calculates averages, zeroes are considered whereas blanks are not.
- To modify how blank measures display in your report, use the Blank measures display as field in the Blank Cells section of the Report Options dialog box.
Show rows or columns when measures are blank
Analyzer hides rows and columns when all measures in the row or column are blank. This default behavior results in the best performance because only combinations of text fields with measure data show on the report.
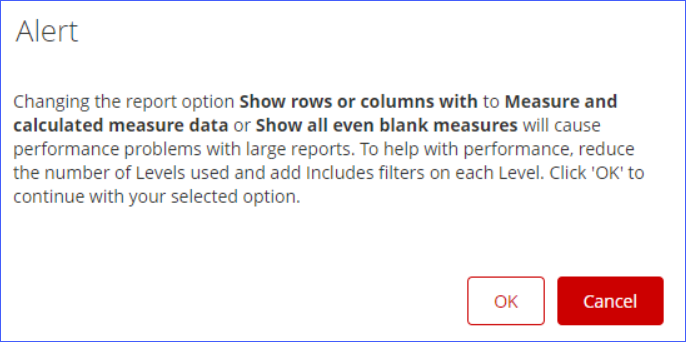
If you have rows or columns where there is no measure data, but there is calculated measure data (for example, 'YTD Sales for a Month' when no sales are recorded for the month), you can choose to show rows or columns with measure and calculated measure data. You can also select to show all columns and rows for blank measures. Because the latter option allows you to show all combinations of text fields regardless if those field have data or not, you may want to limit the number of fields on the report when using this option.
- To modify when to show rows or columns when all measures in the row or column are blank, select an option in the Show rows or columns with field. The options are described below.
| Option | Description |
| Measure data | Returns attribute combinations of fields with measure data that is defined by having a relationship in the database. This option is most frequently used. |
| Measure and calculated measure data | Returns Measure data attribute combinations and additional combinations that are the result of MDX calculations. This option should only be used with the Measure data option. |
| Show all even blank measures |
Returns attribute combinations as a Cartesian join so that you can see combinations even if they have no data at all. Use this option when you want to verify that your dimensions have new data, but there is no corresponding fact data yet. For example, showing Product Line and Sales Territory combinations even if there were no sales. |
This property can be enabled or disabled by your administrator. For more information on this customization, see Control empty rows in reports.
What happens when there is no number field on the report?
The following rules apply:
- If there is only one text field, such as 'Product Line', but no number field on the report, then all values will be displayed. For example, all product lines will be displayed, even those that did not have data.
- If there is more than one text field, such as 'Product Line' and 'Region', but no number field on the report, then the report will hide some values when showing rows or columns with measure and/or calculated measure data. You should not draw any conclusions from the report in this state. Instead, add a number field.
The rules above are designed to minimize the confusion which may result if an expected value does not appear, but you should also consider usability and performance when displaying every single combination of data elements.
Turn on drill-through links
If needed, you can select the columns you want to show in the grid so that report designers only see the selected columns. This is useful if your report cube contains many levels and measures and you want to show only specific data for analysis.
Drill-through links are not available under the following conditions:
- Any calculated measures, including schema-defined calculated measures and user-defined measures, such as percentages, running sum, and trend measures.
- Measures and levels set as hidden in the Available Fields list will not be visible in the Drill-Through view. For more information, see Hide or Unhide Fields.
- Subtotaled cells.
Follow the directions below to turn on drill-through linking in the Report Options dialog box.
Procedure
In the Cell drill-through section, select the Drill-through links on measures check box.
The number fields in your report will turn into links.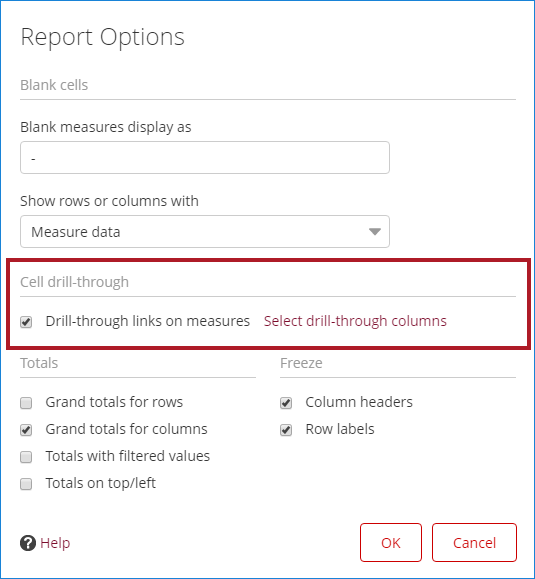
Click the Select drill-through columns to select the columns you want to appear.
Click OK.
The measure fields in your report will turn into links.
Results
Next steps
Options for totals
By default, grand totals do not display when you
view a report as a pivot table. Also, totals never display when you view a report in chart
format.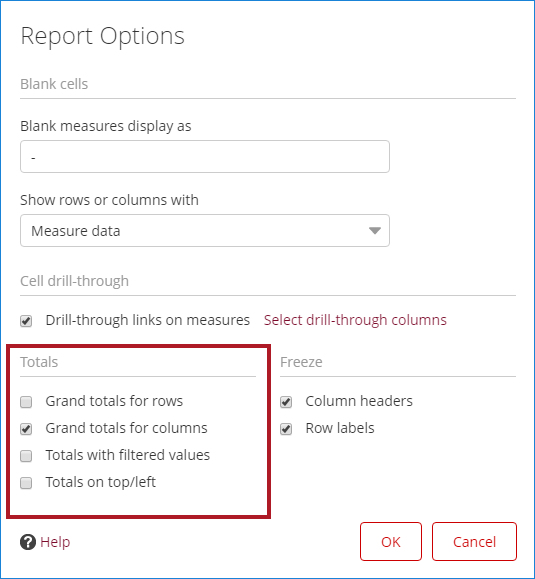
Below are the options for showing and hiding grand totals for rows and columns.
Grand totals for rows
Select to display grand totals for rows in your report.
Grand totals for columns
Select to display grand totals for columns in your report
Totals with filtered values
Select to display totals which include filtered values. By default, totals only display the sum of the values which are visible on the report. If you want to see a total that includes the values that are filtered out, right-click on the Grand Total cell in the report and select Display Totals that Include Filtered Out Values from the menu.
Totals on top/left
Select to display totals at the top for column totals and on the left for row totals in a pivot table. Typically, totals appear at the bottom of columns and at the end of rows.
To hide grand totals while viewing a report as a pivot table, right-click the Grand Total cell on the report, and select Hide Grand Total from the menu. This method does not allow you to show grand totals again once it is hidden.
Freeze column headers and row labels
If you have long columns and rows of data that
extend beyond the viewable area of the report window, you can freeze the column headers and
row labels. When you scroll through your report, your frozen column headers and row labels
always remain visible.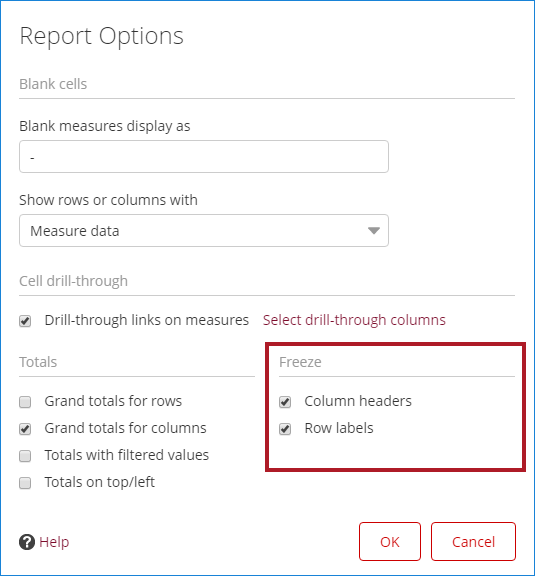
Below are the options for freezing identifying labels for columns and rows.
Column headers
Select to freeze the column headers in your report. The column headers will remain visible when you scroll down.
Row labels
Select to freeze the row labels in your report. The row labels will remain visible when you scroll right.