Monitoring job activity

Lumada Data Catalog maintains a history of job activity. You can view this history by navigating to Manage and selecting Job Activity. The Job Activity page displays all the job templates and individual job sequences that have been submitted by the users, and the status of those jobs. The jobs and their details are listed in the order in which they were submitted.
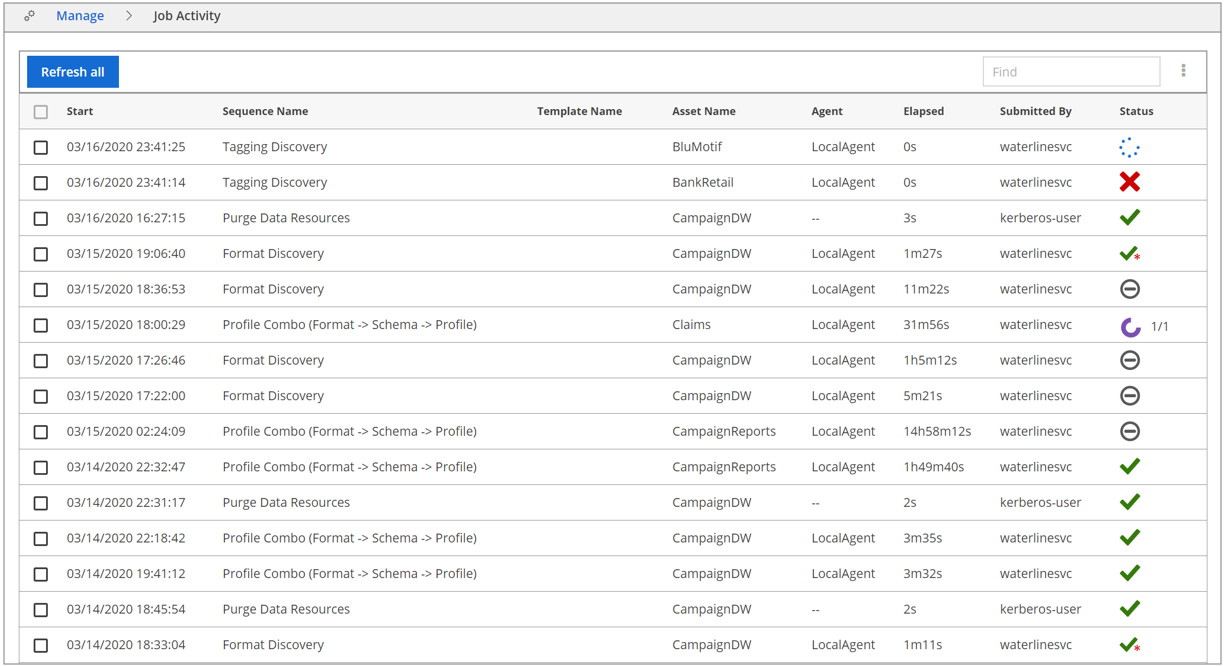
| Field | Description |
| Start | Start time for the job. |
| Sequence Name/Template Name | Name of the sequence or template triggering the job. If a job is triggered using a sequence, the sequence name displays, and the Template Name field is blank. If a job is triggered using a template, the template name displays, and the Sequence Name field is blank. |
| Asset Name | Name of the target resource of the job. |
| Agent | Name of the agent performing the job. |
| Elapsed | Elapsed time of the job. |
| Submitted By | The user that triggered the job. |
| Status | The job completion status. |
Using the Job Activity page
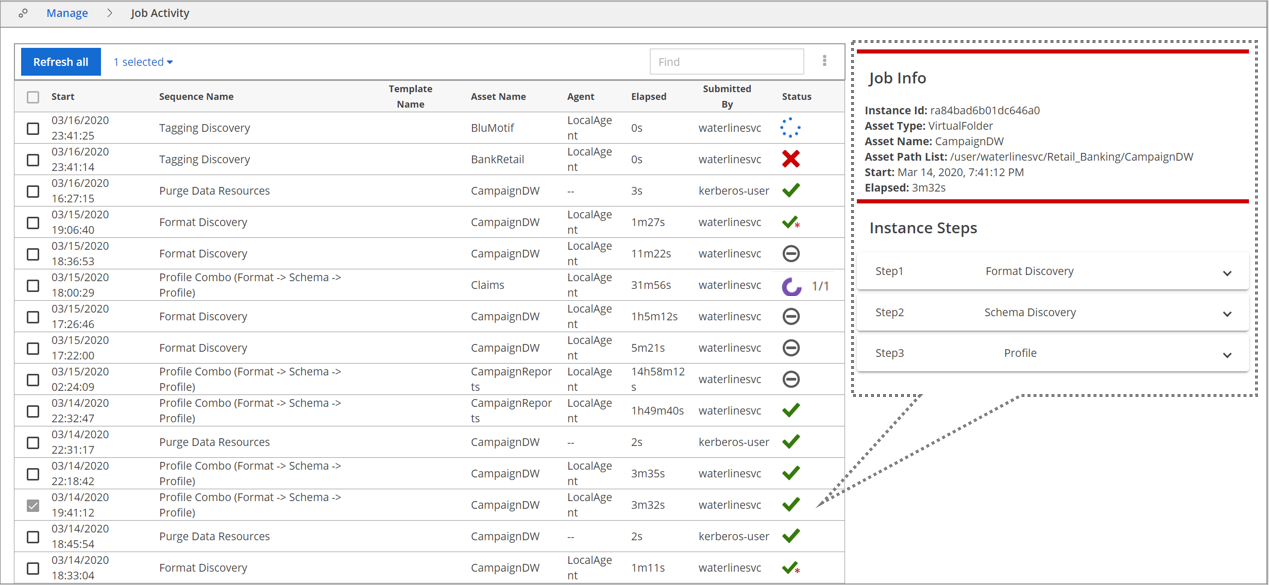
You can view the details of a job by clicking its entry in the Job Activity page. The Job Info pane displays, detailing the sequence or sequences executed for that job.
The icon in the Status column indicates the status of the job. Even when the Status indicates Success, it is possible that the processing status for one of the resources may have failed. To verify the status of the resources, check for the counts of Success/Skipped/Incomplete in the Job Info pane for more details.
In the following example, a sequence or template has triggered a Profile Combo job. The Instance Steps section of the Job Info pane displays the execution details for all the steps involved: Format Discovery, Schema Discovery, and Profile.
| Icon | Status | Meaning |
 | Submitted | The initial status of a job while it is being set up. This status transitions to In Progress. |
 | In Progress | Indicates that the job processes are running. |
 | Success | Indicates that the job has completed successfully. For Profile Combo sequences the status switches between In Progress and Success/Failed for each of the sub jobs involved. |
 | Success with Warnings |
Indicates that the job has completed successfully, but that parts of the job were unsuccessful. Common reasons for this are:
When the job status is Success with Warnings, a FileNotFound error may appear in the Data Catalog job logs. For more details, refer to the Job Info pane or to the job logs. The default log location is the var/log/ldc directory. |
 | Failed | Indicates that the job has failed. Refer to the individual job logs for details. |
 | Canceling & Canceled | The Canceling status indicates a cancel action is in progress. The Canceled status appears when the job dependencies have been successfully freed and the cancel action has succeeded. |
 | Incomplete | The count of resources within the data asset that could not finish discovery due to issues. The numbers indicate (total file skips + incompletes/total files). |
 | Skipped | The job was skipped. For example, the job may not have matched its resource permissions. |
Using the Job Info pane
When you select a job on the Job Activity page, the Job Info pane displays information about that job in the Job Info section. The Instance Steps section displays information about each of the steps in the job. Click the down arrow next to a step to view the processing details of that step.
In addition to including the details captured on the Job Activity page, the Job Info pane has more details in the Job Info section and the Instance Steps sections.
Job Info section
The Job Info section contains the following fields:
| Field | Description |
| Instance ID | The internal reference id used by Data Catalog. |
| Asset Type | Identifies whether the asset is a virtual folder, dataset, or data object. |
| Asset Name | The name of the asset. |
| Asset Path List | Specifies the path of the resource or asset. |
| Start | Time the job began. |
| Elapsed | Length of time the job ran. |
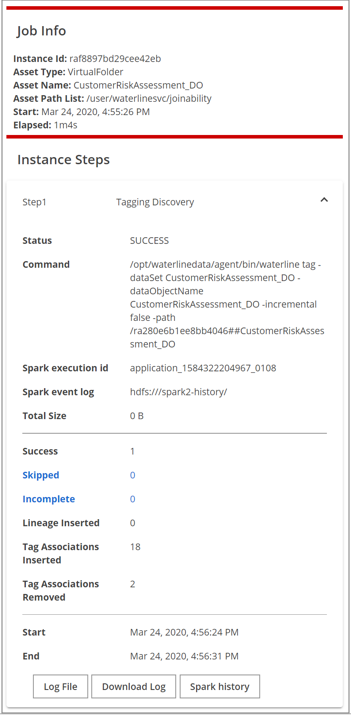
Instance Steps section
The Instance Steps section contains the following fields:
| Field | Description |
| Status | Status of the step. |
| Command | The internal command Data Catalog executes for the job. These commands can also be executed from the command line. |
| Spark execution ID | The Spark application ID for the current job instance. |
| Spark event log | The path to the Spark event log. |
| Total size | Total size of the asset processed. |
| Success | Count of resources that were successfully processed. |
| Skipped | Count of resources that were skipped. Directories are identified as file structures and are skipped while their contents are processed successfully. Resources that are identified as corrupt or in an unsupported format are skipped. Click the count links to view details. |
| Incomplete | Count of resources that were incompletely processed. Clicking on the count links will list details. |
| Lineage Inserted | Count of lineages inserted for the current lineage job. |
| Tag Associations Inserted | Count of tag associations inserted for the current tag job. |
| Tag Associations Removed | Count of tag associations removed for the current tag job. |
| Start | Time the step began. |
| End | Time the step ended. |
| Log File (button) | Navigates to the menu and displays a snippet of the log file contents for this job. See Viewing Data Catalog logs for more details. |
| Download Log (button) | Downloads the log for the step to your local machine. |
| Spark History (button) | Opens the Spark history server and displays details for the instance. |
The following is an example of a log file: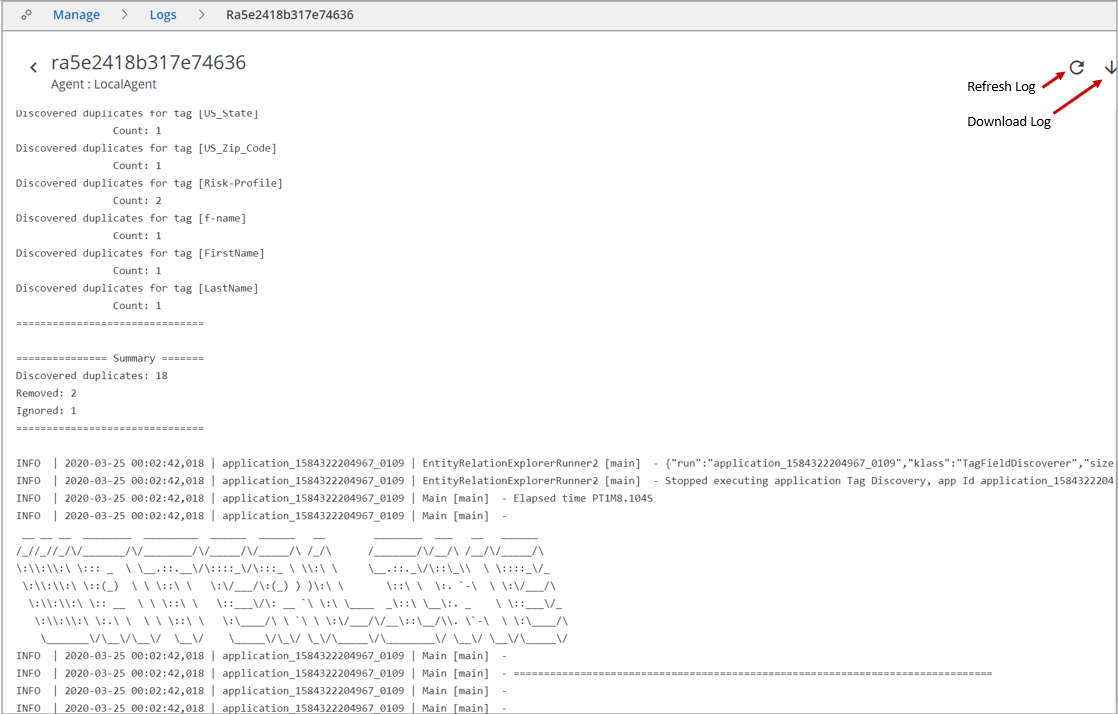
Terminate a job instance
Procedure
Navigate to Manage and select Job Activity.
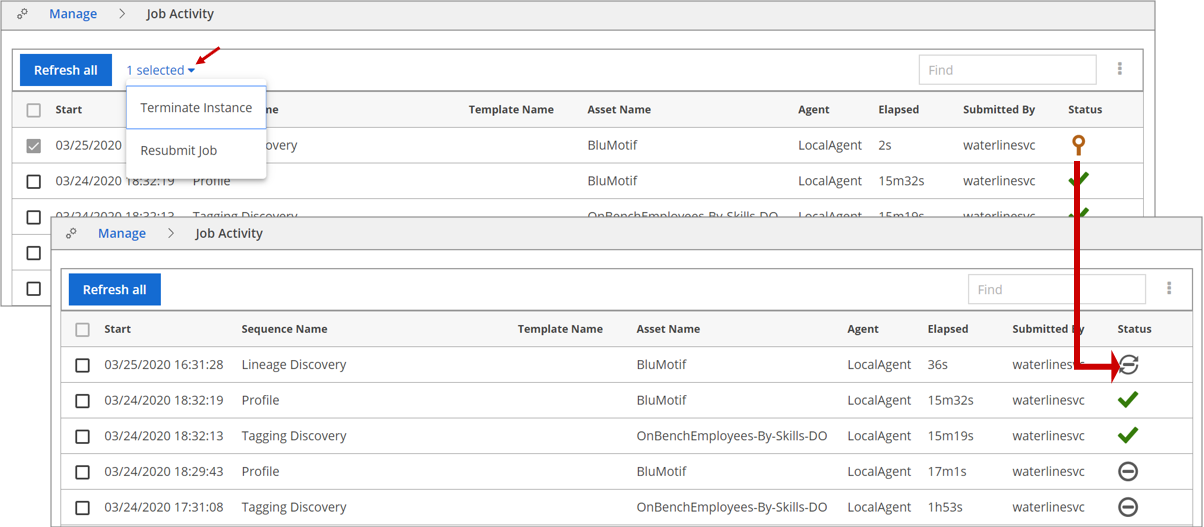
Select the instance (template or sequence) you want to terminate in the jobs list view.
Click the number of selected properties hyperlink and select Terminate Instance.
The instance is terminated. The status for terminated instances changes to Canceled.NoteBecause the termination of an instance is handled by the Spark engine, a terminated sequence may display a Success status in spite of the terminate action command from the user interface. This is more likely to occur with single sequence commands like format/schema/profile/tag when triggered on small sized resources.
Resubmit a job
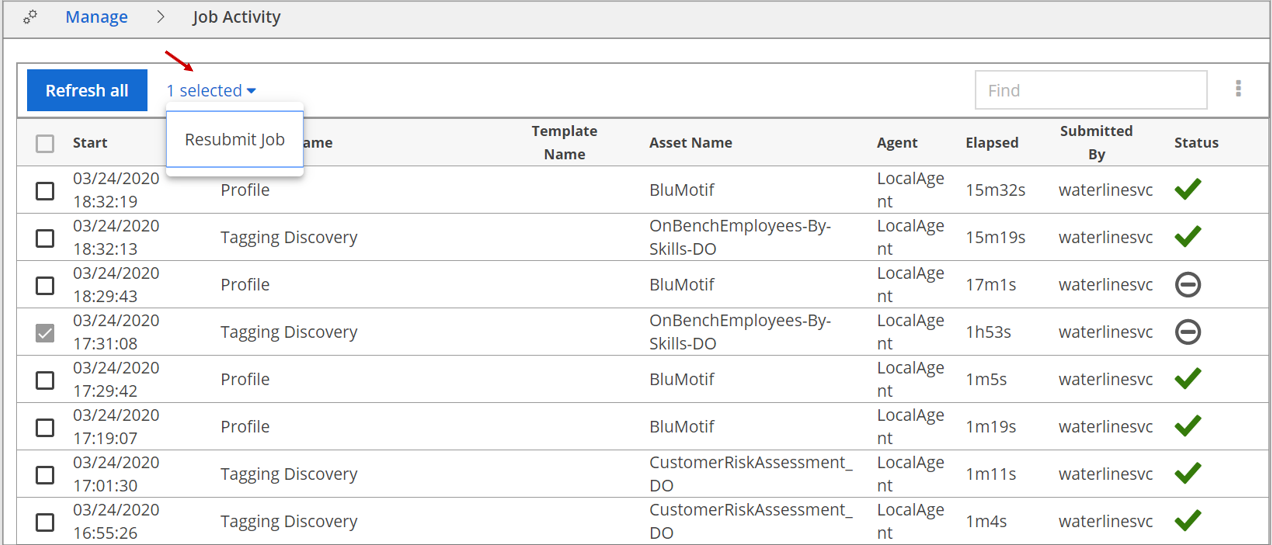
Procedure
Select the job you want to resubmit in the jobs list view.
Click the selected properties hyperlink and select Resubmit job.
The job is submitted with a new Instance ID.
Monitoring Spark jobs
When you run Data Catalog jobs, Data Catalog submits these jobs as spark context to the Apache Spark™ engine. Relevant Spark logging information is captured in the Data Catalog logs.
For example:
INFO  | 2020-07-07 07:31:54,369 | profile | ResourceExplorerRunner [main]  -    spark.yarn.historyServer.address = hdp265.ldc.com:18081
INFO  | 2020-07-07 07:31:54,369 | profile | ResourceExplorerRunner [main]  -    spark.driver.extraJavaOptions = -Dldc.log.dir=/var/log/ldc -Dldc.home=/opt/ldc/agent -Dlog4j.configuration=log4j-driver-client.xml -Djavax.xml.parsers.SAXParserFactory=com.sun.org.apache.xerces.internal.jaxp.SAXParserFactoryImpl -Djavax.xml.transform.TransformerFactory=com.sun.org.apache.xalan.internal.xsltc.trax.TransformerFactoryImpl -Djavax.xml.parsers.DocumentBuilderFactory=com.sun.org.apache.xerces.internal.jaxp.DocumentBuilderFactoryImpl -Dldc.kerberos.keytab.file=ldcuser.keytab -Dldc.kerberos.principal=ldcuser@hitachivantara.com
INFO  | 2020-07-07 07:31:54,369 | profile | ResourceExplorerRunner [main]  -    spark.history.ui.port = 18081
INFO  | 2020-07-07 07:31:54,369 | profile | ResourceExplorerRunner [main]  -    spark.driver.extraClassPath = /opt/ldc/agent/lib/dependencies/commons-lang3-3.9.jar:/opt/ldc/agent/conf:/opt/ldc/agent/keytab:/opt/ldc/agent/ext/hive-serde-1.0.1.jar:/opt/ldc/agent/ext/mssql-jdbc-8.2.0.jre8.jar:/opt/ldc/agent/ext/postgresql-42.2.5.jar:/opt/ldc/agent/ext/ldc-hive-formats-2019.3.jar
INFO  | 2020-07-07 07:31:54,369 | profile | ResourceExplorerRunner [main]  -    spark.driver.extraLibraryPath = /usr/hdp/current/hadoop-client/lib/native:/usr/hdp/current/hadoop-client/lib/native/Linux-amd64-64
INFO  | 2020-07-07 07:31:54,369 | profile | ResourceExplorerRunner [main]  -    spark.history.kerberos.principal = spark-hdp265@hitachivantara.com
Alternatively, you can monitor Apache Spark jobs at one of the following sites:
- Cloudera's Apache Spark History Server:
http://<cluster IP address>:8888/jobbrowser - Ambari's Apache Spark History Server:
http://<cluster IP address>:19888/jobhistory
You may need to additionally specify the Data Catalog service user or, if the service user has a corresponding account, sign in using that user account.
Collecting debugging information
Data Catalog features multiple sources of monitoring information. If you encounter a problem, collect the following information for Data Catalog support.
See Setting logging properties for more information about each source in the following list.
Job messages
Data Catalog generates console output for jobs run at the command prompt. If the job encounters problems, review the job output for clues to the problem. These messages appear on the console and are collected in log files with the debug logging level: /var/log/ldc/ldc-jobs.log.
Spark job messages
Many Data Catalog jobs trigger Spark operations. These jobs produce output that is accessible on the cluster job history server and also through Hue’s job browser or the Ambari Spark job history.
You can open the Spark job log that corresponds to the profiling operation for a given file or table by opening that resource in the browser and following the link in the profile status.
Application server messages
The embedded Jetty application server produces output corresponding to user interactions with the browser application, including the installation process. These messages appear on the console and are collected in a log file: /var/log/ldc/ldc-ui.log
Use the tail command to see the most recent entries in the log:
$ tail -f /var/log/ldc/ldc-ui.log