Restart the Pentaho Server and test the visualization

Restart the Pentaho Server. Once the server has restarted, you will see the visualization
Example KPI registered in the list of visualizations when creating
an Analyzer report. Create a new
report with the custom visualization selected. If you save the report and re-open it, and
the visualization settings are remembered. Click on the XML link to view the report XML and
visualization state JSON which is helpful in debugging state saving issues: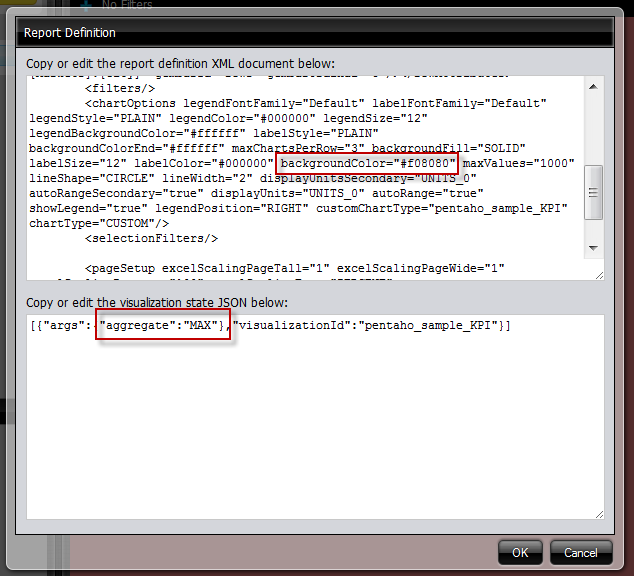
Test your visualization in the various browsers that will be used. You can add the XML text in the Report Definition dialog box.
More complex examples included in the Pentaho Server noted in Define the custom visualization. These examples go beyond this section, including functionality such as server-side printing, lassoing, and selections.