Register the visualization with Pentaho Analyzer

After registering the component with the Visualization API, you need to register the component with Pentaho Analyzer. This step is necessary so that Analyzer can customize its layout panel for the visualization, and to manage the serialization of the visualization's metadata.
To register with Analyzer, create a file in the example-visualization/resources folder called example_analyzer_plugin.js, and add the following content to the file:
var analyzerPlugins = analyzerPlugins || [];
analyzerPlugins.push(
{
  init:function () {

	// Register visualizations to display in Analyzer
    cv.pentahoVisualizations.push(pentaho.visualizations.getById(
      'pentaho_sample_KPI'));

    /*
     Helpers contain code that knows about the Analyzer specific context. The one
     function that's required "generateOptionsFromAnalyzerState" is called so the
     visualization can set its own options based on Analyzer's current report.
     */
    cv.pentahoVisualizationHelpers['pentaho_sample_KPI'] = {
    // Use one of Analyzer's stock placeholder images.
    placeholderImageSrc: CONTEXT_PATH
      + 'content/analyzer/images/viz/VERTICAL_BAR.png',

    /*
     This method allows a visualization to generate visualization specific
     options based on Analyzer’s report definition. In the following example,
     this visualisation is setting a background color using the same background
     color setting in Chart Options. You can figure out the existing chart
     options by looking at the report XML by clicking the XML link in Analyzer.
     @return a hash object containing the custom state of your visualization.
     */
    generateOptionsFromAnalyzerState:function (report) {
      return {myBackgroundColor:
      report.reportDoc.getChartOption("backgroundColor")};
    }
  };

    /*
     LayoutConfig objects manage the interaction between Analyzer's Layout Panel
     and the visualization's settings.
     */

    // Declare a new class which extends the built-in version from Analyzer.
    dojo.declare("SampleConfig", [analyzer.LayoutConfig], {

    /**
     * @param config    The parse Configuration object which serves
     *                  as the model of the Panel.
     * @param item      The item in the panel which originated the event.
     * @param eventName The name of the event (clicked, value, etc).
     * @param args      A Hash Object containing relevent values (prevVal,
     *                  newVal, etc).
     */
    onModelEvent: function(config, item, eventName, args) {

    if (eventName == "value") {
    // This component has a single argument, so we assume if this event is
    // fired it is for the aggregate option.
    // This will update the visualization args with the new value for
    // aggregate. Also note that when the Analyser report is saved, a
    // snapshot of the visualization args will be saved to the report XML.

    this.report.visualization.args['aggregate'] =
      config.byId('aggregate').value;

    //Add a report state item to the undo/redo history stack.

    this.report.history.add(new cv.ReportState("Update KPI Aggregation"));

    //Trigger a report refresh so that the visualization is updated with the
    //change.
    this.report.refreshReport();
    }
    this.inherited(arguments);
    // Let super class handle the insertAt and removedGem events.
    }
  });


    // Register the Layout Panel Configuration Manager.
    // Note that the string entry matches 'JSON_' plus the visualization id
    // defined earlier.
    analyzer.LayoutPanel.configurationManagers['JSON_pentaho_sample_KPI'] =
      SampleConfig;
    }
  }
);
In this example, you register a single visualization with Analyzer. The object definition in this
JavaScript contains three main components. The first is the init() method
call, this is called when Analyzer
initializes the visualization. In this method, the visualization registers all the necessary
handlers for working directly with Analyzer. The two handlers are the VisualizationHelper object
and the LayoutConfig class.
The
VisualizationHelper object contains code that is specific to getting your
visualization to work in the context of Analyzer. The key function is to implement
generateOptionsFromAnalyzerState, which is used to extract settings from
the Analyzer report XML which can
then be used in your own visualization.
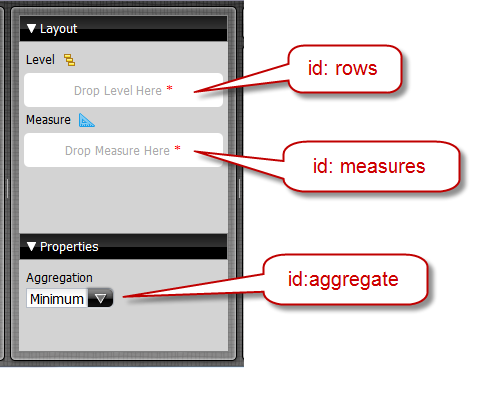
The Layout
panel in Analyzer is generated
dynamically from the JSON data requirements definition of the visualization. For example,
notice that the visualization automatically generated Level,
Measure, and Aggregation components based on
the rows, measures, and aggregate dataReq items:
In order for your visualization to respond to changes made in the panel,
you registered the SampleConfig configuration manager with Analyzer.
Configuration managers may extend the following methods:
| Method | Description |
getConfiguration(): | Returns the Layout panel definition.
Normally, you will not need to extend this method. The default implementation in
LayoutConfig will create gembars for dataReqs
with dataStructure = column or row and restore the state by looking
at the report XML attributes and measures. For custom properties such as the
Aggregation drop-down in the above example, the default
implementation will retrieve the current value from either the
generateOptionsFromAnalyzerState function or from the
visualization.args hash map. |
updateConfiguration(config): | This is called on every report change and allows you to modify the layout panel state based on the current configuration. An example use case would be to make all gembars no longer required if any one of them contained at least one gem item. |
checkAcceptance(source, nodes, silent): | Called by drag-and-drop operations in the panel. Return true if the operation is allowed. Normally you would not need to extend this method. |
onModelEvent(config, item, eventName,
args): | All Layout panel interactions result in
onModelEvent calls to the active configuration manager. These
events will typically do one of three things:
|