Use filters to explore your data

You can explore your data in the inspection canvas by applying one or more filters and then view the results in the visualization.
When inspecting your data, filters can be used to restrict or limit data to only include information that you want to view. See Filter Functions for a list of filtering options.
Depending upon the view chosen (Stream or Model), you can filter data by dragging fields from the Available Fields list to the Filters panel. You can also filter data directly in the visualization by drilling down or using the filter pop-up menu (keeping or excluding certain items). Only filtering selections made in the Filters panel can be edited. You can access many frequently used filter options using keyboard shortcuts.
Drill down into your visualization
Drill down is used to explore a specific dimension or measure of your data and to obtain more details on the next hierarchy levels. In Model View, you can drill down within a visualization into the hierarchies in your dataset.
When drilling down, you automatically apply filters according to the hierarchical field structure of your data, which replaces the parent with the child in the associated drop zone (except when using the Pivot Table, where the child is added to the hierarchy). The filter used for the drill down is added to the Filters panel and the visualization is updated accordingly.
In following examples, various drill down and filtering actions are illustrated:
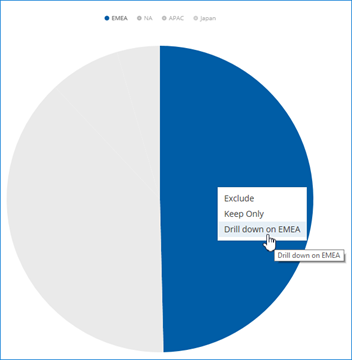
- To drill down into the next layer of dimensional data, you can click a data
point in a visualization and then select Drill down.
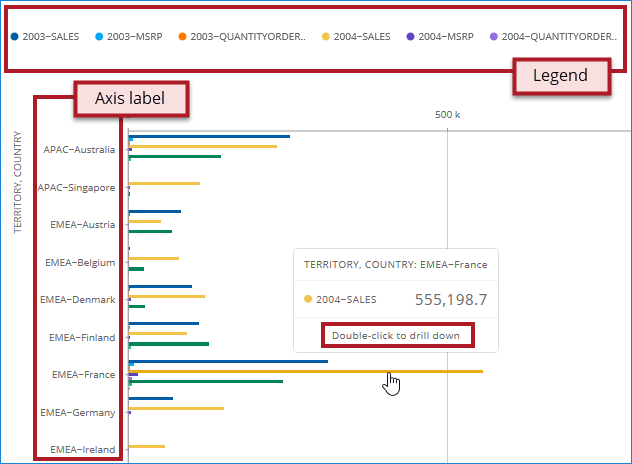
- To drill down into layers of hierarchical data, you can double-click a data
point, axis label, or legend. Note that in cases where more than one hierarchy is
available for drill down, the first available option is automatically selected.
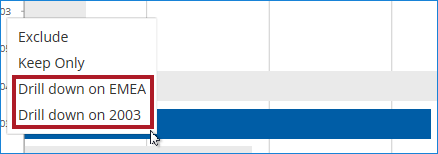
- When a data point has more than one dimension, you can select what dimension
to drill down to from the menu.
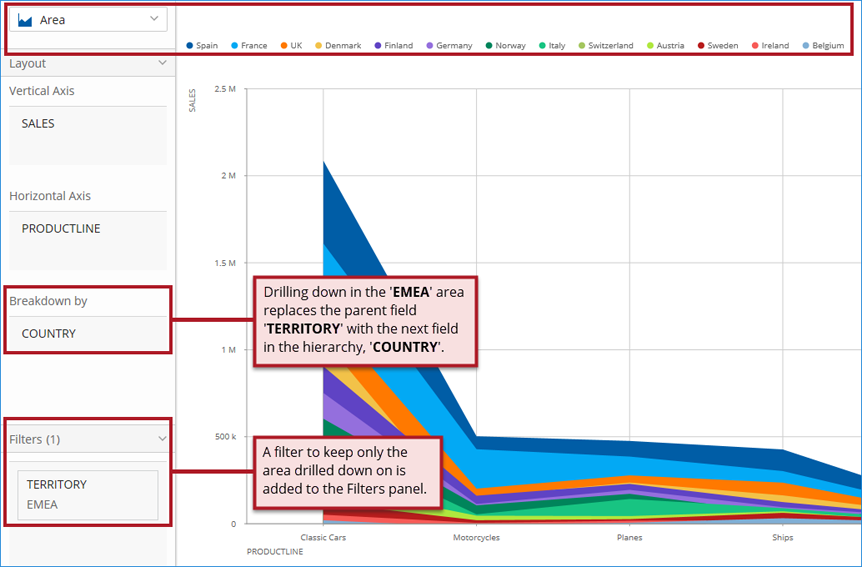
In this example, you want to explore motorcycle sales data for the EMEA geography field to analyze the results for each country inside that territory.
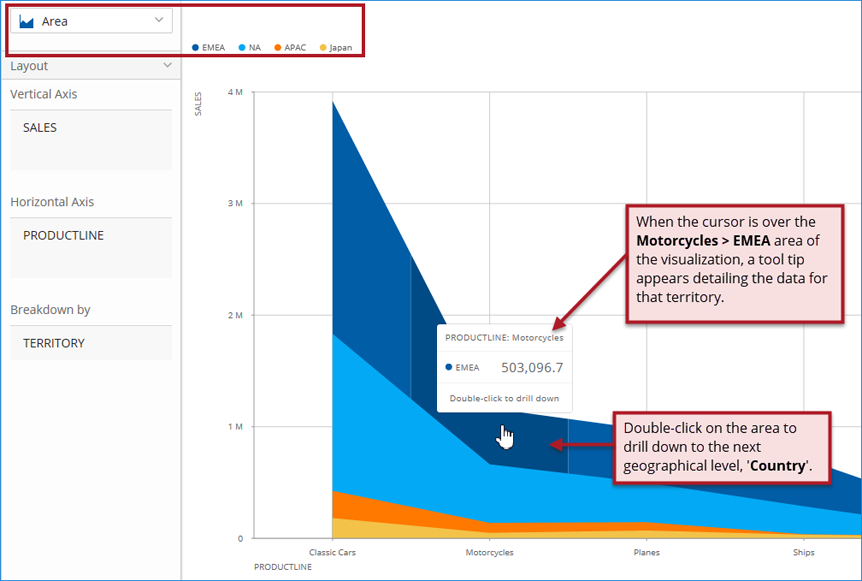
- A filter to show the value that was drilled down on is added to the
Filters panel. The chart updates to break down the motorcycles
sales data by ‘COUNTRY’ for the 'EMEA' territory.
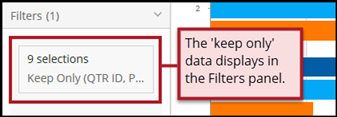
Keep or exclude selected data in your visualization
In Stream or Model View, you can select data points to keep only the selected data, or to exclude that data from your visualization.
- To keep or exclude a single data point, click the data point in your
visualization. A filters pop-up menu displays.
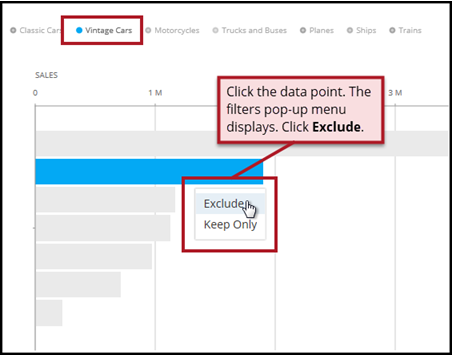
- Click Exclude or Keep
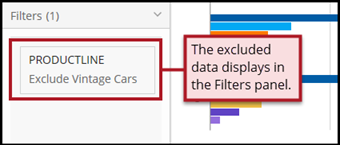
Only. The visualization updates your view and the
Filters panel displays the filtered data point.
- Click Exclude or Keep
Only. The visualization updates your view and the
Filters panel displays the filtered data point.
- To keep only or exclude multiple data points, press the
CTRL key while clicking additional data points, axis labels, or
the legend in your visualization. Release the CTRL key to display
the filters pop-up menu.
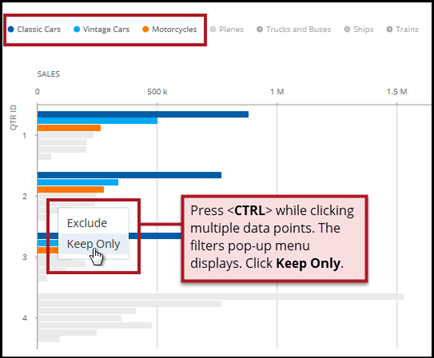
- Click Exclude or Keep
Only. The visualization updates your view and the
Filters panel displays the filtered data points.
- Click Exclude or Keep
Only. The visualization updates your view and the
Filters panel displays the filtered data points.
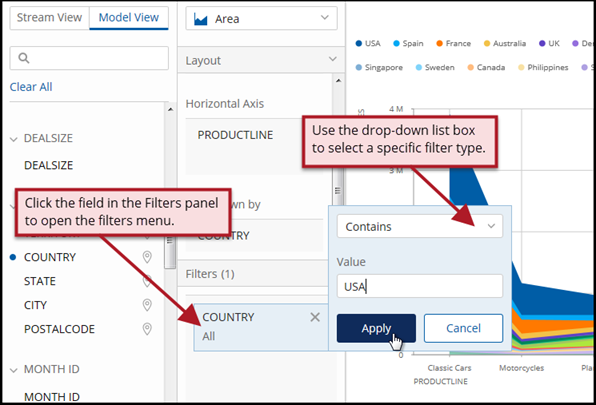
Add a filter using the Filters panel
In Stream or Model View, you can drag fields from the available fields panel into the Filters panel and then define the filter.
- Drag a field into the Filters panel, and then from
the interactive filters menu, make your selections to apply the filter to a visualization.
Remove a filter from the Filters panel
Hover over the field in the Filters panel and click Close (X on the top right corner).
Filter examples
The following are examples of working with filters in Stream View and in Model View.
Work with filters in Stream View
In Stream View, to apply a filter to a flat table or other visualization, drag a field from the Available Fields panel to the Filters panel.
Use the Select or Exclude filters
In Stream View, you can use the Select filter to search a list of values for a field and then choose the values to apply. Alternately, you can use the Exclude filter to search a list of values for a field and then choose values to omit.
The search method you use to find values can be performed manually from the list of available values or by using the search box to narrow the choices in longer lists. The following illustration shows the features of the Select filter:
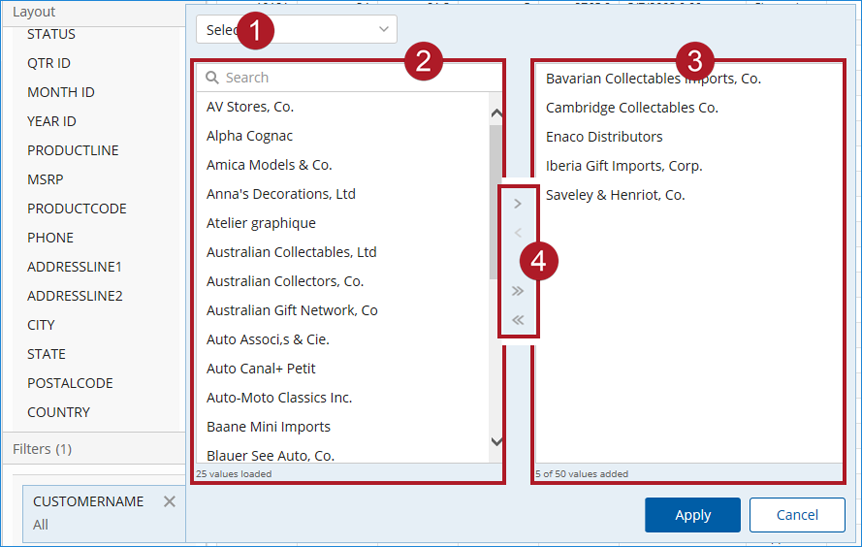
In the table below, use the preceding illustration to reference the features of the Select and Exclude filters.
| Item | Feature | Description |
| 1 | Filter type | Shows the name of the current filter, for example Select or Exclude. |
| 2 | Left pane* |
Shows the values available for the Select or the Exclude filter, and includes:
Highlight the values that you want to use for the filtering action and then move them to the right pane. |
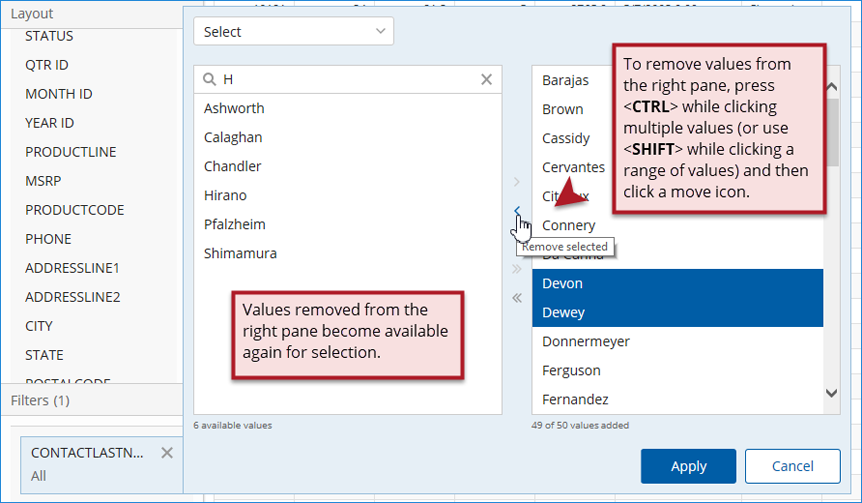
| 3 | Right pane* |
Shows the values added, which determines the filtering action of the Select or the Exclude filter, and includes:
If you have values that you do not want to use for the filtering action, highlight and then move them to the left pane. |
| 4 | Move icons |
Use to add or remove values from the right pane, where:
|
|
*Single and multi-select actions are supported: Use double-click to move single values; CTRLclick to highlight multiple individual values; and, SHIFTclick to highlight a range of values. | ||
Select filter example
Procedure
From the Available Fields list, drag the CONTACTLASTNAME field to the Filters panel.
The Filter menu automatically displays.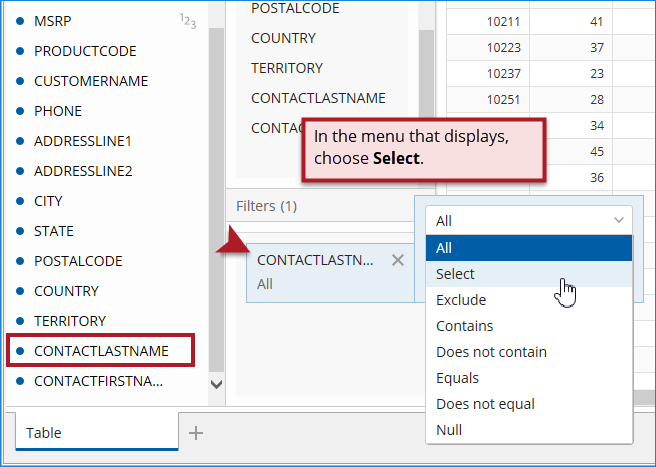
Choose the Select filter to produce a list of contact names in the left pane and then enter characters and character patterns in the Search box to find contact names that contain those characters in the database.
The left pane displays names that result from your search.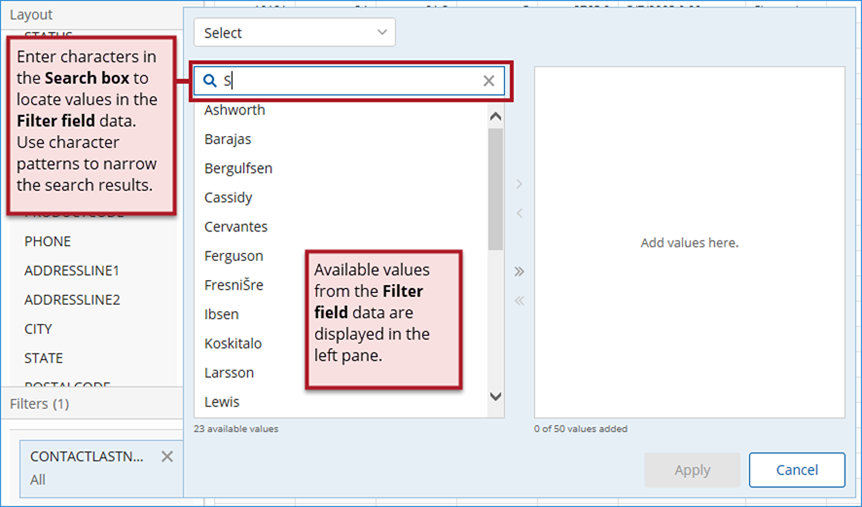
Add the names you want to use for filtering by highlighting and moving them to the right pane. Continue searching for names and add them to the right pane. You can add up to 50 names.
These names are the values that will be used for the Select filter.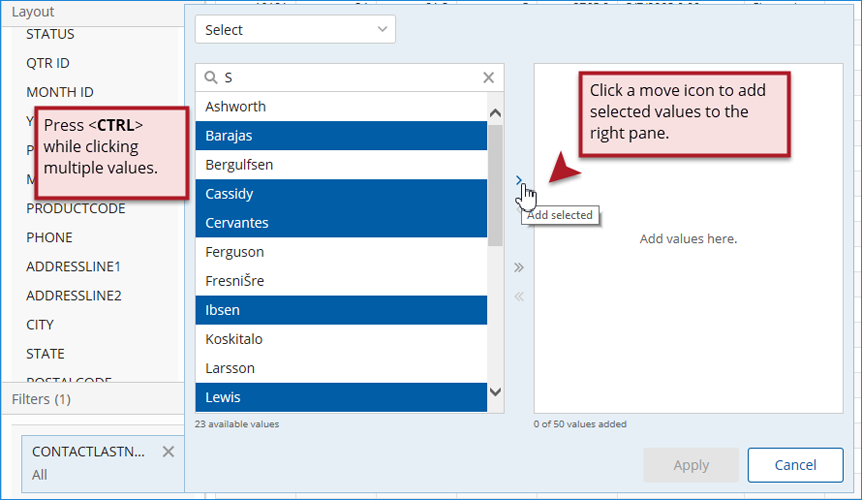
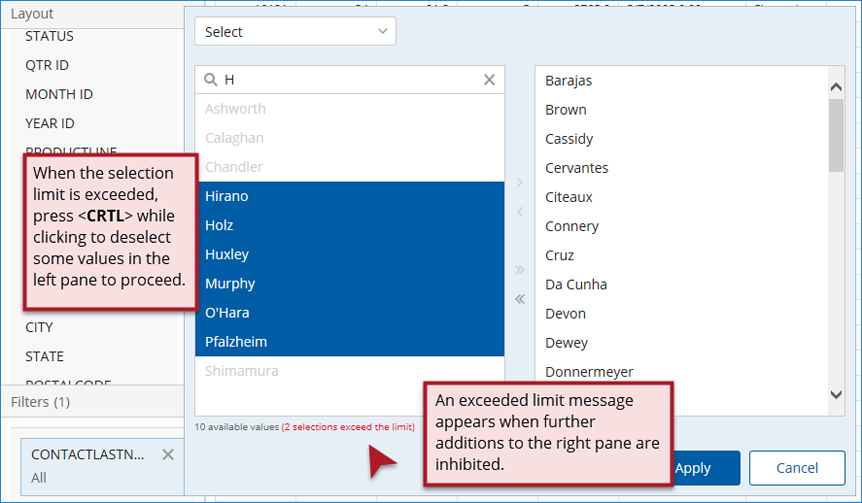
If needed, refine the list of names already chosen. Note that the Apply button is enabled when any values are ready to be used as the Select filter.
Click Apply to proceed with filtering when your list is complete or the maximum number of values has been added.
The table updates to only show the selected contact names.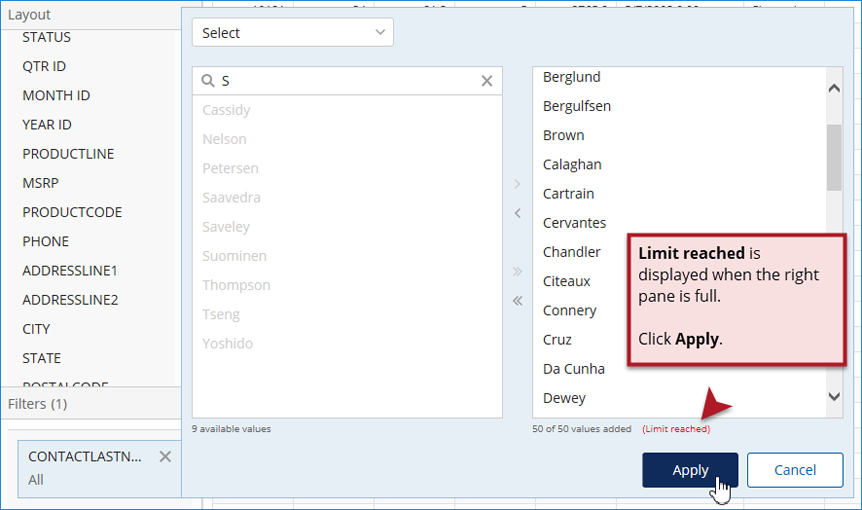
Work with filters in Model View
Procedure
From the Available Fields panel, drag the 'TERRITORY' to the Filters panel.
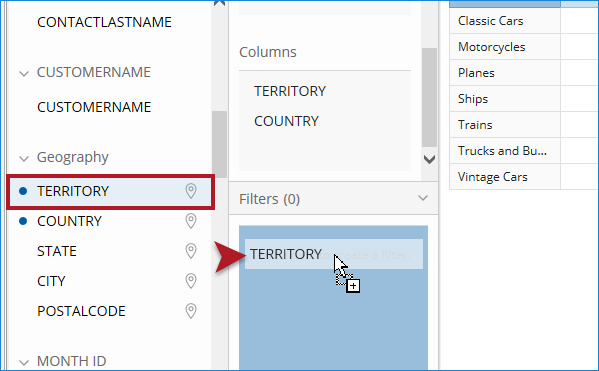
From the interactive filters menu, make your selections to apply the filter to a visualization.
When the filter is applied, the Filter panel updates 'TERRITORY' to equal 'EMEA', and the pivot table updates to only show sales in countries in Europe, the Middle East and Africa.
Keyboard shortcuts for filter options
Begin by selecting the filter from the Filters panel that you want to apply or modify then, depending on the desired action, use the keyboard shortcuts described below. Navigation moves left/right and up/down through all elements, beginning with the Value field (when present), where highlighting indicates your position within the selected filter. When sufficient information to proceed exists, the Apply button is enabled. These keyboard shortcuts apply to the following filters:
- Contains
- Does not contain
- Equals
- Does not equal
- Null
- Greater than
- Less than
| Function | Shortcut Keys |
| Apply the filter when Apply is enabled | Enter |
| Forward navigation within a filter* | Tab |
| Reverse navigation within a filter* | ShiftTab |
| Open a dropdown when highlighted | Enter |
| Upward navigation within a dropdown | Up Arrow |
| Select an option from the dropdown | Enter |
| Downward navigation within a dropdown | Down Arrow |
| Select a checkbox when highlighted | Space bar |
| Navigate through the Null filter radio buttons | Up Arrow or Down Arrow |
| Apply the highlighted Apply or Cancel button | Enter |
| *OS X users: For correct tab navigation, you must enable the full keyboard access: Go to and select All controls | |