Third-party monitoring with SNMP

The main goal of the Simple Network Management Protocol (SNMP) plugin is to provide large enterprises a way to integrate with third-party tools to monitor Data Integration (DI) events. The information received through SNMP will help you figure out the run-time for your transformations or jobs and identify unusually long-running events impacting network performance. These SNMP events can be directly tied to a particular point in time within the execution, such as the moment a transformation started, or a Kettle step finished execution. These events can be used in a broader scope, such as a successful database connection or a Carte server initialization.
The SNMP plugin works by leveraging existing extension points within the Kettle ecosystem to generate events. These events are then converted into SNMP traps, such as unsolicited or asynchronous messages, that are sent along from an SNMP agent. From there, the events are forwarded to the SNMP manager, which is passively listening for such messages.
Before you begin
Procedure
On the Customer Portal home page, sign in using the Pentaho support user name and password provided in your Pentaho Welcome Packet.
Click Downloads, then click Pentaho 9.2 GA Release in the 9.x list.
On the bottom of the Pentaho 9.2 GA Release page, click the Client Tools > PDI (Spoon) > Plugins folder in the Box widget and download the pentaho-monitoring-plugin-mib-assembly-9.2.0-dist.zip file.
Next steps
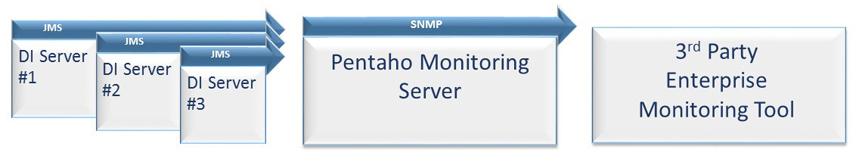
Send traps through a centralized monitoring server
One option for setting up SNMP monitoring on your network is to use one of your existing Pentaho Server as a JMS monitoring server to handle the trap events it receives from a queue. This server then forwards those events available through SNMP to whichever third-party monitoring tool you have installed.
Step 1: Configure Pentaho Server to send trap events
Procedure
Locate this directory and open the current pentaho-osgi-config-xxx-snmp.cfg file in any text editor.
pentaho-solutions/system/karaf/system/pentaho/pentaho-osgi-config/xxx
Find the property for fromHost and set the IP address to match your Pentaho Server.
Find the property for toHost and replace it with the IP address of your monitoring server.
If your SNMP port is something other than the default (port 162), change it in this file to match your port.
Configure your other Pentaho Server to NOT perform SNMP monitoring. They are configured to do so by default.
Open the org.apache.karaf.features.cfg file, located in the pentaho-solutions/system/karaf/etc/ directory.
Find the featuresBoot property and verify that pentaho-monitoring-2-snmp and pentaho-monitoring-jms-broker are not in the file. If they are, delete them.
Add pentaho-brokering-jms and pentaho-monitoring-to-snmp within the featuresBoot property.
Save and close the org.apach.karaf.features.cfg file and start the Pentaho Server.
Next steps
A new pentaho.snmp.cfg file is automatically generated based on the updated information contained in pentaho-osgi-config-xxx-snmp.cfg.
After you are done with this procedure, any kettle jobs or transformations that are executed on that Pentaho Server will send SNMP trap events to the designated monitoring server’s IP address.
Step 2: Configure the monitoring tool to recieve trap events
The Pentaho Server is already configured by default to handle messages. A management information database (MIB) is used for managing entities in a communications network. The structure is hierarchical with each entry assigned an object identifier (OID).
Upload the MIB file to monitoring tool
Procedure
Access the third-party SNMP tool web interface.
Locate an option for managing MIBs.
Upload the PENTAHO-MIB-V2C.mib file that you downloaded earlier.
Convert the MIB file to a configuration file
Procedure
Access the monitoring server through SSH protocol with the root user, for example:
ssh root@10.100.9.174
After successfully logging in, find the directory containing your uploaded MIB file, such as: /usr/share/snmp/mibs/
Run the snmpttconvertmib command, stating the path to the uploaded file, and the path for the compiled output file:
snmpttconvertmib
--in=<PATH_TO_UPLOADED_MIB_FILE>
--out=<PATH_TO_COMPILED_OUTPUT_FILE>--
exec='/usr/local/bin/snmptraphandling.py "$r" "SNMP Traps" "$s" "$@" "$-*"'
snmpttconvertmib --in=/usr/share/snmp/mibs/PENTAHO-MIB-V2C.mib
					--out=/etc/snmp/pentaho.di.conf --exec='/usr/local/bin/snmptraphandling.py "$r"
					"SNMP Traps" "$s" "$@" "$-*"
Add the newly generated configuration file to the SNMP initialization file
Procedure
Open and edit the file /etc/snmp/snmptt.ini using a text editor.
Locate the
[TrapFiles]section; it should be at the bottom of the file.Place the entry for your newly created config file after the main one but before the END declaration.
For example, if you use a default snmptt.ini file, it should look something like this:[TrapFiles] snmptt_conf_files = <<END /etc/snmp/snmptt.conf /etc/snmp/pentaho.di.conf END
Save and close the file.
Restart the monitoring server and the snmpttservice:
/etc/rc.d/init.d/nagios stop
/etc/init.d/snmptt stop (wait ~5 seconds)
/etc/init.d/snmptt start
/etc/rc.d/init.d/nagios start
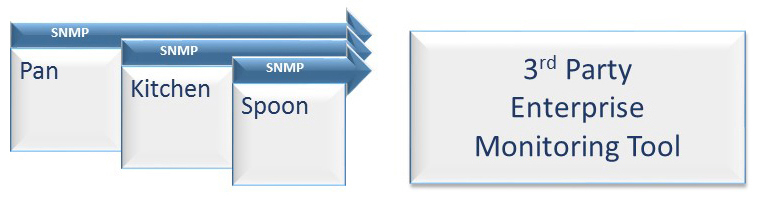
Send traps from PDI tools to monitoring tool
Instead of sending traps through a centralized monitoring server first, you can set up your SNMP system to have the trap events sent directly from PDI client tools, such as Pan, Kitchen, or the PDI client. A couple of different ways are available to set up the monitoring application through these tools.
Follow one of these options to configure your SNMP environment to run through the PDI client tools.
From all PDI client tools
Procedure
Locate the below directory and open the org.pentaho.features.cfg file with any text editor.
data-integration/system/karaf/system/pentaho/pentaho-osgi-config/6.0.0
Add pentaho-monitoring-to-snmp as a feature at the end of the
featuresBootlist.If your SNMP port is something other than the default (port 162), change it in this file to match your port.
Save and close the file.
From a specific PDI client tool such as Carte
Procedure
Find the org.pentaho.features.cfg file in that client's etc folder.
Add pentaho-monitoring-to-snmp to the
By default, everything BUT the PDI client features are disabled, so you will have to uncomment theruntimeFeatureslist.runtimeFeaturesfor the other tools.If your SNMP port is something other than the default (port 162), you will need to change it in this file to match your port.
Save and close the file.
Configuring the type of events to be monitored
Procedure
Locate the directory: /pentaho-server/pentaho-solutions/system/karaf/system/pentaho-osgi-config-6.0.0-pdi-monitoring
Open and edit the monitoring.properties file as needed.
Locate the property for extension.point.plugins.enabled, which holds a comma-separated list of event types for which SNMP trap events will be sent to the monitoring server.
Immediately above that property, a comment section lists all possible event types, as well as a brief description for each event type.
Edit that list, leaving only the items you would like to use as SNMP trap events.
Save the file and restart the Pentaho Server.
Available extension points
| Extension Points | Description |
| TransformationPrepareExecution | A transformation to prepare execution |
| TransformationStart | A transformation has started |
| TransformationHeartbeat | A signal sent at regular intervals to indicate that the transformation is still active |
| TransformationFinish | A transformation finishes |
| JobStart | A job starts |
| JobHeartbeat | A signal sent at regular intervals to indicate that the job is still active |
| JobFinish | A job finishes |
| JobBeforeJobEntryExecution | Before a job entry executes |
| JobAfterJobEntryExecution | After a job entry executes |
| DatabaseConnected | After a successful connection to a database |
| DatabaseDisconnected | After a successful disconnection to a database |
| CarteStartup | Right after the Carte webserver has started |
| CarteShutdown | Right before the Carte webserver shuts down |