Add report elements

Most report elements can easily be added by dragging and dropping them from the Palette or the Data pane to one of the layout bands. In some cases, there are a few extra details that you should know before you dive into report creation. Certain sections below may apply to your project.
Report layout types
You can change the layout type by selecting any of the band elements in the Master Report item in the Structure pane, then selecting one of the options from the layout drop-down box in the Size & Position section of the Properties pane. Choosing a layout scheme will deselect the layout checkbox.
The bands in a report can have a few different methods of content layout:
Canvas
The default layout scheme is canvas, in which report elements have no positioning relationship to one another, and can potentially encroach on the space occupied by other elements in the band. The three other layout types are defined in the sections below.
Block
Elements in a block layout band are arranged vertically. Block-level elements span the full width of the parent band. If an element expands, it pushes all other elements down so that no element overlaps any other elements. Master Report and SubReport elements, as well as Groups, are always block elements.
Inline
In an inline formatting context, elements are arranged horizontally, one after the other, beginning at the top of a containing block. Horizontal margins, borders, and padding are respected between these boxes. The boxes may be aligned vertically in different ways: their bottoms or tops may be aligned, or the baselines of text within them may be aligned. The rectangular area that contains the boxes that form a line is called a line box. An inline element that is placed in a non-inline layout band creates an artificial paragraph to wrap around this element. The most common use of this layout strategy is to produce rich-text content from several independent report elements.
Row
The row layout scheme positions elements one after each other on the horizontal axis. All elements are printed in a single row, expanding their height as needed. If all elements expand to the height of tallest element, set the min-height to "100%" to even them out. This layout type is a natural match for list reports, where multiple columns of data should be printed per row. When an element expands its width, all other elements get pushed to the right. When you use a row layout for your list reports, you will no longer need to arrange elements manually. To create spacing between elements, use either padding on your elements, or place an empty band as a padding element into the row layout band. The Report Design Wizard makes use of the row layout to position elements in the details and details-header bands.
Add standard design elements
Before you begin
Follow this process to add design elements to a report.
Procedure
If you have not already done so, click the Structure tab in the upper right pane.
If the Data tab is selected, you will be unable to edit the attributes or styles of any report elements.Click the design element you want to add, then drag it into the report band that you want to add it to, roughly in the position where you want it to appear.
Once the element is placed, it will change from a grey shape to a transparent element with an inline label and blue resize handles.Click the resize handles and drag them out to the desired dimensions.
If necessary, click the center of the element and drag it to a different location within the layout band.
You cannot drag an element from one band to another. If you want to move something to a different band, you must cut and paste it. Dragging an element toward the bottom of the band will increase the size of the band.With the new report element selected, examine the options in the Attributes and Style panes and make any necessary changes or customizations.
Any changeable aspect of a report element can be changed through these two panes. For a complete reference that explains every property of every element, consult the Element Attributes Reference and Style Properties Reference sections of this section.To delete an element, click to select it, then press the Delete key, or right-click the element and select Delete from the context menu.
Results
Align elements
Report Designer has several features to help you easily align your report elements.
The following alignment tools can be found in the View menu:
Grids
show a graph-paper-like grid on the report canvas. This can make it easier to evenly space elements by counting the exact number of hash marks between them. Grids can also make it easier to line up elements, but you may find it easier to rely on guides instead.
Guides
are markers you create by clicking on the rulers on the top and left of the report canvas. Once you have guides in place, it's easier to align report elements vertically and/or horizontally. To turn off guides, go to the Guides submenu in the View menu, then un-check the Show Guides item. You can remove individual guides by right-clicking them on the ruler, then selecting Delete from the context menu.
Element Alignment Hints
extends each report element's outer borders to the edges of the canvas, allowing you to easily line up multiple elements.
Snap to Elements
adds a kind of magnetism to elements so that they are easier to align with adjacent elements.
Add bands
Follow this process in order to create a band (formerly called a sub-band in older versions of Report Designer), which allows you to group several report elements into a single area.
Procedure
Drag and drop a band element into a layout band.
Using the resize handles, change the size of the band to fit your specifications.
Drag and drop an existing report element into the new band and position it according to your preference.
Drag and drop other elements into the band as necessary.
Results
Create sub-reports
You can create sub-reports within your current report. This enables you to display data from multiple sources.
Procedure
Drag and drop a Sub-Report element from the Palette to the layout band where you want to display it.
A Sub-Report dialog box will ask if you would like to make this an inline or banded element.
Choose one.- Inline Sub-Reports can be placed side-by-side with other elements (even other Sub-Reports).
- Banded Sub-Reports occupy a variable height, but 100% of the report page width, so they cannot be on the same line with other elements.
Double-click the Sub-Report element.
A new report tab will open and capture the window focus.In the new report tab, establish a data source and create a report as your ordinarily would, keeping in mind that this will be included in the parent report. When you are finished, switch back to the main report tab.
Results
Placing inline and banded sub-reports
Every master-report and sub-report you lay prints its sections on a position relative to its original location on paper. For a master-report, the location is always the upper left corner of the first page (x=0, y=0). Therefore, all sections of that report will be printed on the left edge of the paper (x=0).
When you add sub-reports to a report, that sub-report can be located on any x-position on the paper. For banded sub-reports, usually that position is the same left-edge as the parent-report's location.
Inline sub-reports can be placed more freely on reports. The sub-report's left edge corresponds with the sub-report element's x- and y- position within its parent report. They can be at a position that is different from their parent report's left-edge position. When you add an new inner sub-report to such this sub-report, the inner sub-report's effective position is the offset of this report in its parent sub-report and all of their offsets within their respective parents.
The dark-grey area on the left hand side of your sub-report is not usable for elements contained in your sub-report. If you want to place elements there, you will have to re-position your sub-report within its parent report.
This now shows the sub-report at exactly the position where it will be shown on paper and allows you to easier align elements contained within different sub-reports.
Refer to report elements by name or column position
If you enabled Display the index columns in the Report Designer's field selectors... in Preferences, you can refer to report elements by field name or by column position. This feature allows you to create a report that isn't locked to a field name, rather it is locked to the position of the query when the report runs; for example, column 0, column 1, column 2, and so on.
Locking to the query can be particularly useful when users create their own queries. When the report renders, the data displays in predictably mapped columns. This feature works with all data field types, groups, and formulas and functions.
Locking elements and formulas to the column position allows report designers to have more flexibility so that a single report can be used with any query regardless of the data source type (JDBC, Mondrian, Pentaho Metadata, and so on.). For example, this feature may be used by a report designer where the designer substitutes fields of report based on different queries that have a completely different set of column names.
Create a table of contents
The Table of Contents (TOC) feature is similar to a sub-report. It allows you to generate a TOC based on groups you have mapped inside the report or to specify the sub-reports you want included in your TOC.
Follow the instructions below to create your TOC:
Procedure
Click and drag the table-of-contents icon onto the report canvas.
You are prompted to make the TOC element Inline or Banded. Choose one.- Inline sub-reports can be placed side-by-side with other elements (even other sub-reports).
- Banded sub-reports occupy a variable height, but 100% of the report page width, so they cannot be on the same line with other elements.
Click the TOC element and Define the following attributes for the TOC element:
group-fields
Defines both the depth of the data-collection and the fields from where to read the group-value-X values. If the group-field given in the array is empty, the field value will be read from the current relational group and in the details-processing, the value will be null. If the group-fields list is empty, an automatic mode is activated that collects all groups extracting the group-value from the relational group.
collect-details
Defines whether detail items should be included in the data-collection.
NoteThis attribute consumes a significant amount of system memory. Do not use this attribute on reports that are over a million rows.title-formula
Defines a formula that is evaluated when a new item has been collected. The formula will only be evaluated if the title-field is not set.
title-field
Defines a field in the master-report that will be read for a valid item-title.
title-formula
Defines a formula that is evaluated when a new item has been collected. The formula will only be evaluated if the title-field is not set.
index-separator
Defines the separator text that is used between the index-elements. It defaults to ".".
Double-click the TOC element.
A new sub-report tab opens.In the new report tab, create the appropriate TOC headings and add the group value you want mapped. Add an item-page function to generate the page numbers.
Keep in mind that all your entries will be included in the parent report. When you are finished, switch back to the main report tab.Preview your report.
Results
Next steps
Create an index
The Index feature is also similar to a sub-report. It allows you to generate an index based on fields or groups in your report. When the index is generated, it displays the instances and page number where the field name appears.
Procedure
Click and drag the index icon onto the report canvas.
You are prompted to make the index element Inline or Banded. Choose one.- Inline sub-reports can be placed side-by-side with other elements (even other sub-reports).
- Banded sub-reports occupy a variable height, but 100% of the report page width, so they cannot be on the same line with other elements.
Click the index element; under Attributes, double-click data-field and select the field to which you want to map.
In the example below, the data-field is mapped to PRODUCT NAME.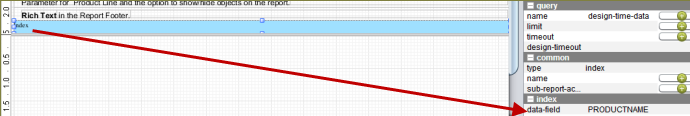
data-field
Defines the field to be used as the item-data or item-key.
data-formula
Defines an open formula to be used as the item-data or item-key. Make sure that data-field is not defined, if this is used.
index-separator
Defines the separator text that is used between page numbers in the item-pages field in the index sub report. It defaults to ",".
condensed-style
Defines whether a - is used between continuous page numbers; example, 4,5,6,7 would display as 4-7.
Double-click the index element.
A new sub-report tab opens.In the new report tab, create the appropriate index heading. Add the item-data and item-pages functions to generate the index data field name and page numbers.
Keep in mind that all your entries will be included in the parent report. When you are finished, switch back to the main report tab.Preview your report.
NoteThe index appears on the last page of your report.
Results