Extend Pentaho Analyzer with custom visualizations

You can develop third-party visualizations and integrate
them into Pentaho
Analyzer. This section will
show you how to create an example KPI Visualization. The example will show you how to
generate a simple Key Performance Indicator (KPI) which
calculates a minimum, maximum, or average on a single measure across a single
level.
In this example, you create this
visualization: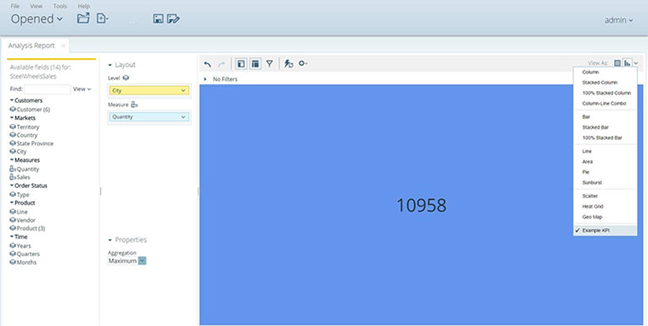
This visualization generates a simple KPI that calculates a minimum, maximum, or average on a single measure across a single level.
To extend a custom visualization, perform these actions in order.
Procedure
Create a Pentaho Server plug-in.
See Create a Pentaho Server plug-in for further details.Define the custom visualization.
See Custom visualizations for further details.Register the visualization with Pentaho Visualization API.
See Register the visualization with Pentaho Visualization API for further details.Register the visualization with Pentaho Analyzer.
See Register the visualization with Pentaho Analyzer for further details.Register the created JavaScript files with Pentaho Analyzer.
See Register the created JavaScript files with Pentaho Analyzer for further details.Restart the Pentaho Server and test the visualization.
See Restart the Pentaho Server and test the visualization for further details.