Monitoring system activity and logs

Lumada Data Catalog tracks the events that occur to folders, files, collections, tags, origins, and user profiles. As an example, for a selected file, Data Catalog tracks file tag creation in the system, tag association with the file, lineage discovery involving the file, and tag associations with fields in the file.
Viewing system activity
If you are assigned the Administrator role, the System Activity feature captures all user actions performed in the Data Catalog. As an administrator, you can use the information provided by the System Activity feature to troubleshoot issues and monitor user activity.
To view system activity, click Manage from the main Data Catalog navigation menu, then click the System Activity tile.
Three types of user actions are listed in the audit history:
- Actions performed by users from inside the browser application, which are marked with the name of the user's account.
- Actions performed by users through an application using the Data Catalog REST API, which show the username used to authenticate the API calls.
- Actions performed by users from the command line, which typically logs them as a service user or Kerberos user.
In addition to the name of the user who performed the action, System Activity also indicates the date and time of the action, the action performed, and any details.
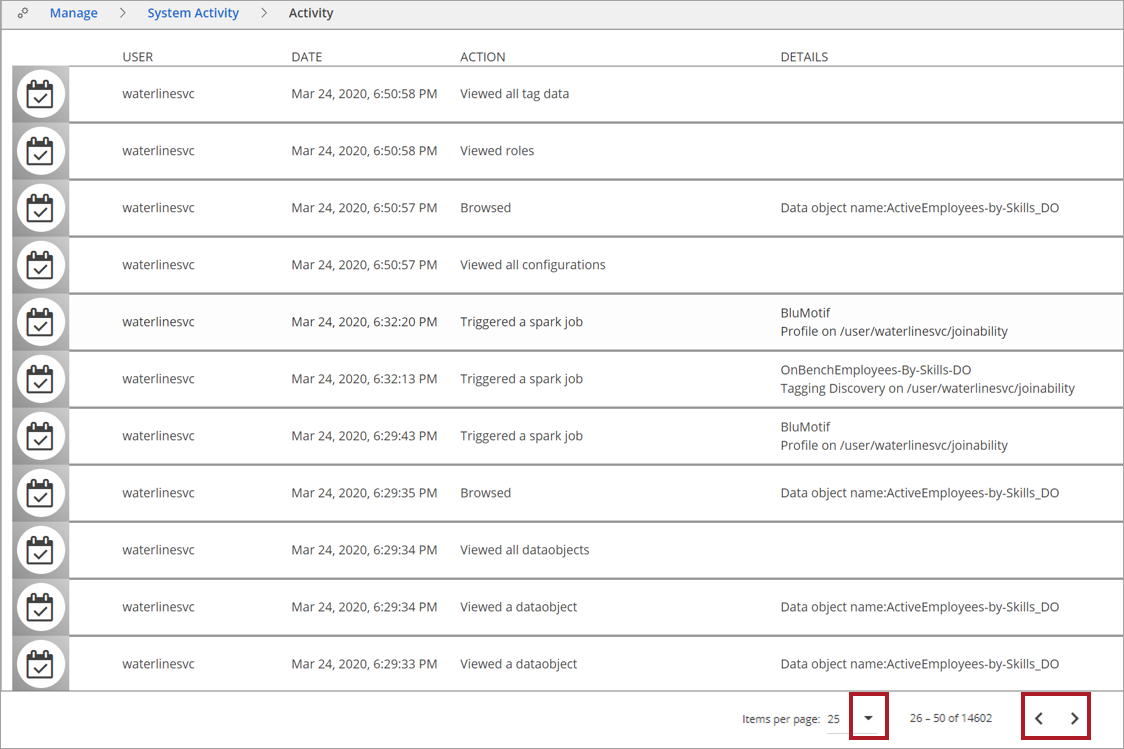
In the System Activity page, the actions appear in reverse chronological order with the most recent action listed first.
By default, the most recent twenty-five actions are shown per page. To navigate to previous actions, or to change the number of actions displayed per page, use the pagination options at the bottom of the System Activity page.
Viewing Data Catalog logs
Data Catalog maintains logs of all the jobs that run for cataloging, as well as the metadata access jobs executed by the web application server/Jetty for diagnostic purposes. These logs are stored in the /var/log/ldc directory as ldc-jobs.log and ldc-ui.log files.
To view the logs, click Manage from the main Data Catalog navigation menu, then click the Logs tile.
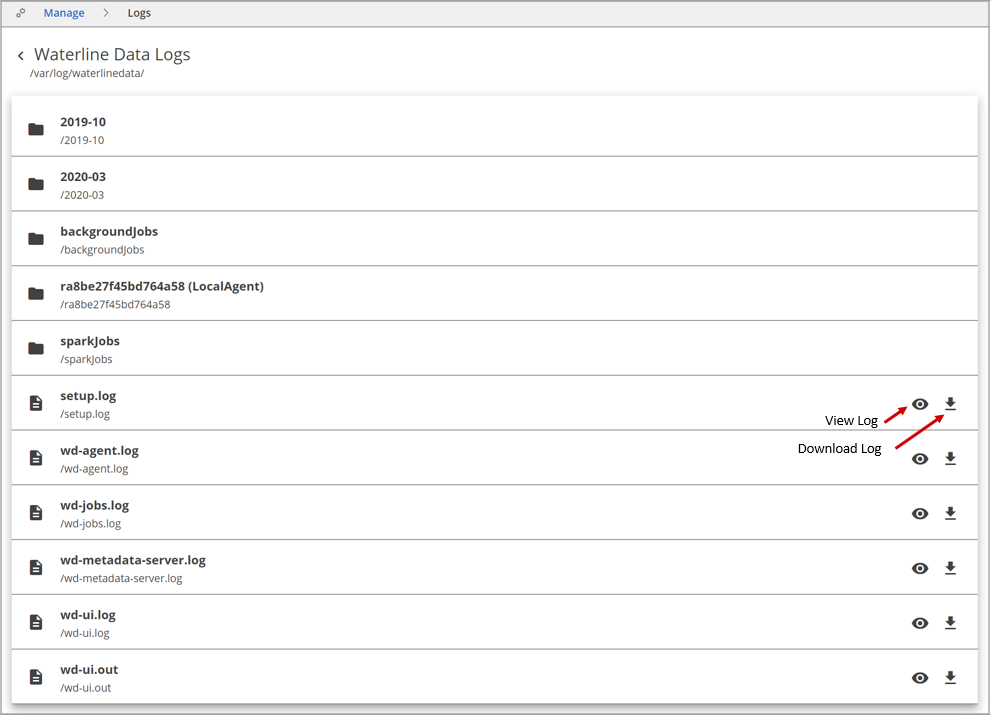
The Logs menu displays the directory structure as it appears in the /var/log/ldc directory. The logs are categorized as follows:
Spark Jobs
These logs are created by the Spark engine when executing any Data Catalog commands.
Setup Log
Refer to these logs when interpreting any Data Catalog setup-related issues.
WD-Jobs Log
These logs are created and updated by Data Catalog's processing engine when it executes any Data Catalog jobs, whether triggered from a browser or command line.
WD-UI Log
These logs record activities occurring through the interface of the application server.
To view a log, click the View Log icon. The last 500 lines of the logs generated are displayed by default. You can configure up to 2000 viewable lines by setting the ldc.web.log.viewer.preview.num.lines property in the conf/configuration.json file.
To download a log, click the Download Log icon.
Data Catalog also supports the print-to-PDF method in your browser. For example, in Chrome, when analyzing the results in the job activity page or viewing a resource, you can right-click on the page and select print, or press CtrlP for a print menu, and select the PDF option. Note that if you are using a different browser, for example Mozilla FireFox, you may need an extension to use the print-to-PDF method.