Exploring your data

In Lumada Data Catalog you can create different types of virtual data containers that make it easier for you to access and manage the metadata of your data sources based on your access level. These virtual data containers include the following:
Virtual folders
A virtual folder is a group of resources with the same data source type. Virtual folders can have overlapping sets of data resources. The
rootvirtual folder may contain virtual folders, collections, and files. See Manage virtual folders.Collections
A collection is a group of files with the same format and schema that Data Catalog recognizes, arranges hierarchically, and categorizes during profiling. See View a collection
Datasources
With Data Catalog, you can connect to data sources in file systems, Hive, relational databases such as AWS, HCP, Oracle, SQL databases, and JDBC sources. You can browse the schema, tables, and fields of your data sources. See Manage data sources.
Data Canvas
Use the Data Canvas to explore and investigate your data. Here, you can find detailed insights into resource metadata to help you understand and clarify practical applications. Click the Explore Your Data card on the landing page to open the Data Canvas view and begin exploring your data. Be sure to add at least one data source to Data Catalog before exploring. See Manage data sources.
The Data Canvas is divided into four primary areas:
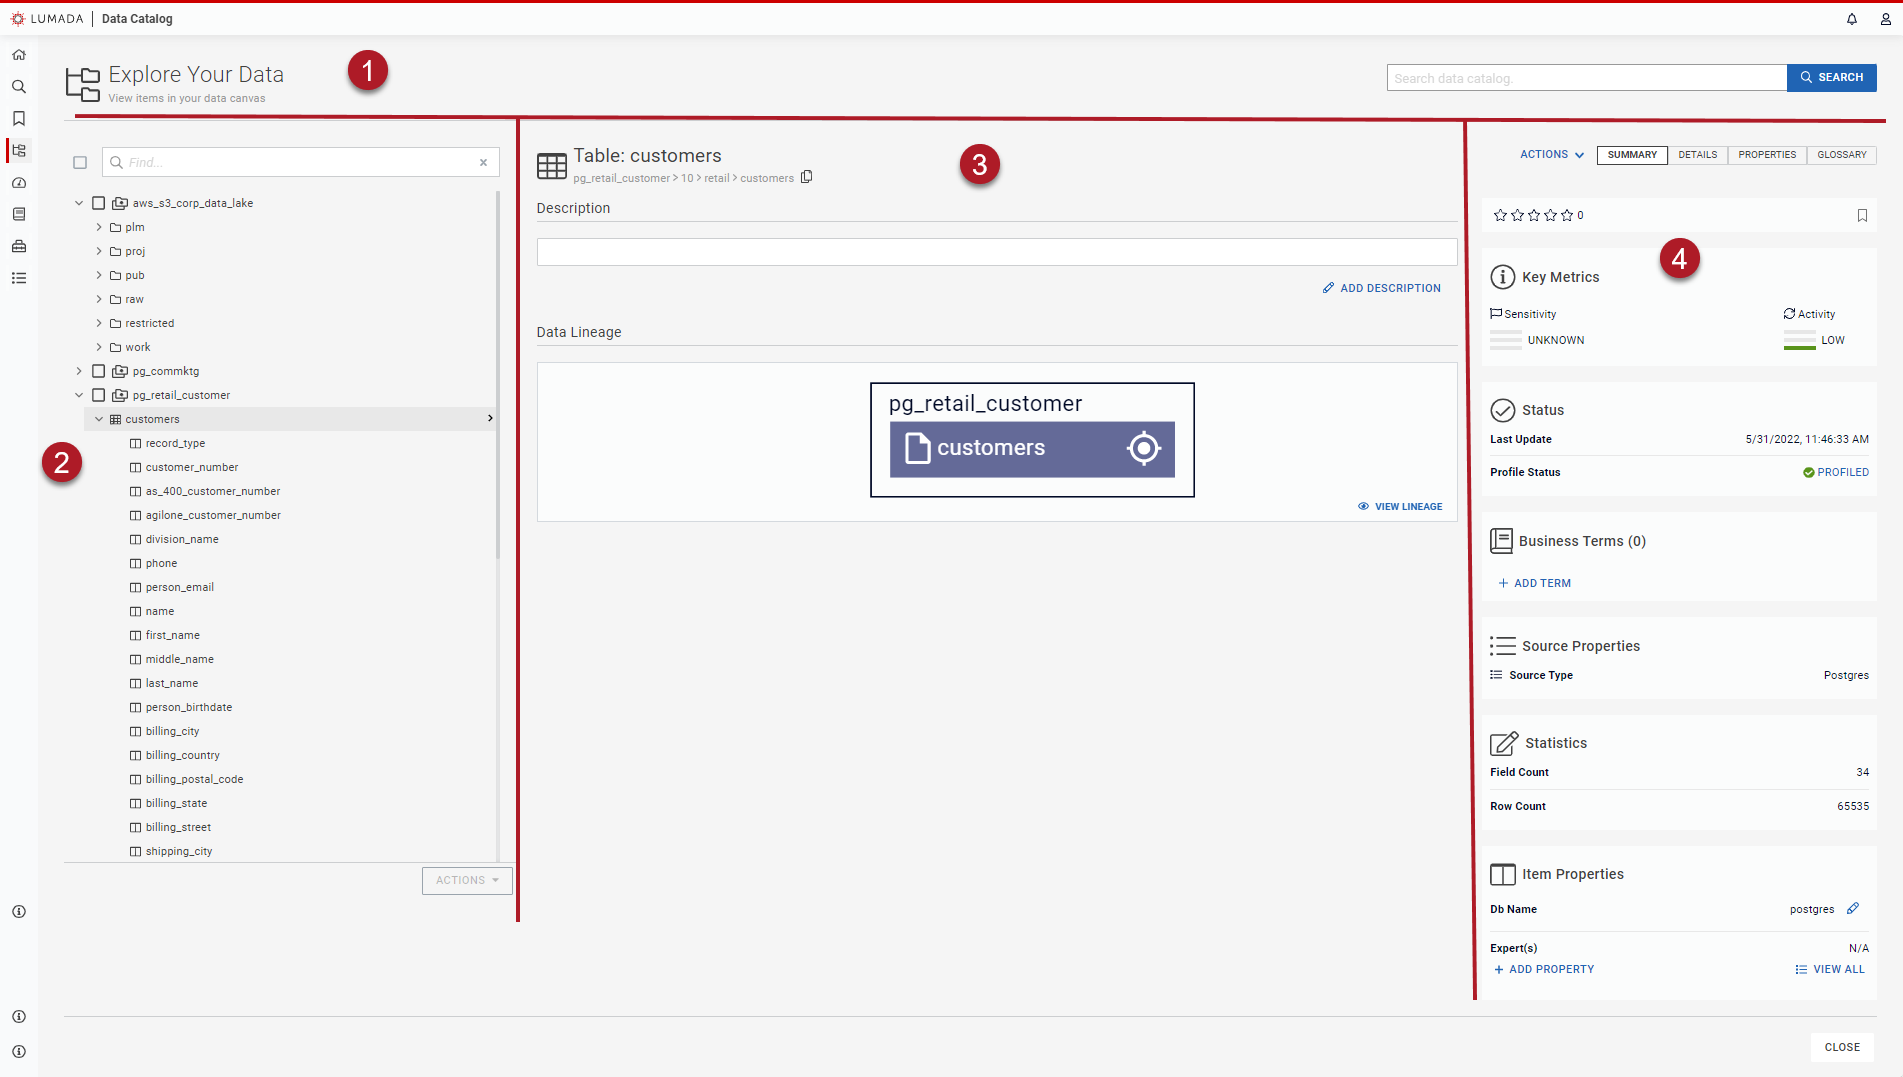
| Item | Name | Description |
| 1 | Top Navigation | Perform a global search of all the data sources. |
| 2 | Navigation | Navigate the tree of data resources to find the one you want to explore in the canvas. |
| 3 | Content | Displays information about the selected resource. For example, if you select a folder or schema, the metadata appears in the Content pane. |
| 4 | Data Summaries | View different summaries of applicable information, such as data lineage snapshots, sample data, key metrics, and business terms. |
Data Canvas top navigation pane
Enter a term in the search box to perform a global search of all the data sources. See Searching Data Catalog.
Navigation pane
Navigate the tree of data resources to find the one you want to explore in the canvas.
Enter a search term in the Find field to search for resources such as virtual folders, folders, collections, schemas, tables, files or fields within the navigation pane.
In the tree view on the navigation pane, you can view the data resources and virtual folders contatined in Data Catalog. Select the check box next to the data source you want to work with, then view the structure of your data source in the Content pane.
When you select an individual resource, the resource name is highlighted in the tree view and the metadata of that resource displays in the Content pane. You can view the name of the selected item and the path in the banner.
Click the More actions menu on the right of each resource in the navigation tree to scan, process, or bookmark that resource.
- Select Scan to immediately scan the resource.
- Select Process to open the Process Selected Items page, which lists the processes you can run on your resource.
- Select Bookmark to add a bookmark to your Bookmarks page.
Alternatively, you can perform an action on a resource by selecting the checkbox next to the resource in the Navigation pane, click Actions at the bottom, then click Process. The Process Selected Items page opens.
Content pane
You can view details about the selected resource in the Content and Data Summary panes. The details displayed depend on the type of resource selected. For example, if you select a table, then you can view the contents of a column or field, the resource-level metadata with Data Catalog's data analysis, discovered and seeded or accepted terms, cardinality for fields, and sample values.
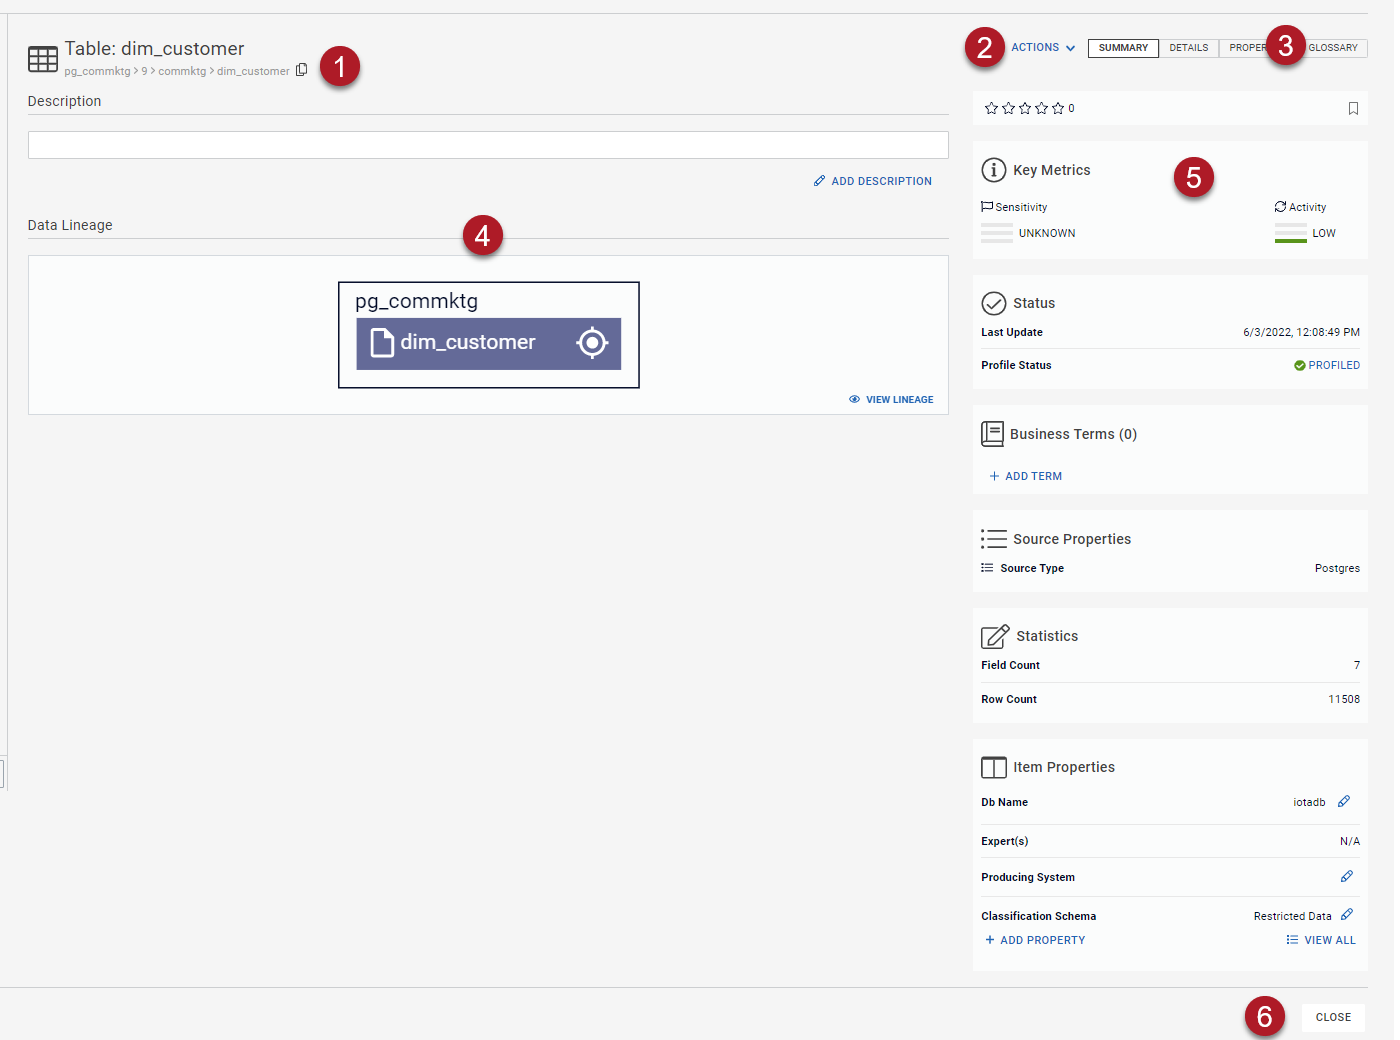 The following table identifies the key details available in the Content and Data Summary panes for a table resource:
| Item | Name | Description |
| 1 | Data banner | Displays the name, path, and type icon identifying the resource. The name and type attributes identifying the resource are provided. You can click the Copy icon at the end of the breadcrumb trail to copy the path to the resource. |
| 2 | Actions button | Click to view actions available for processing, saving, and copying the data, depending on the selected asset type. The actions you can take in the data content area are: change to a Galaxy view of the data, process the selected data, and copy the resource ID of the data. |
| 3 | Data tabs | Click to view additional information about the resource. |
| 4 | Data Lineage | Displays information about lineage. |
| 5 | Key Metrics | Displays information about Sensitivity and Activity. |
| 6 | Close button | Click to close the page and return to the Home page. |
When you select a table, you can view the Field Count and Row Count statistics in the Data Summary panel. The following table identifies the key details available in the Content pane when you select a column in a table to view:
| Feature | Description |
| Min | The minimum value in the column. |
| Null Count | Number of entries that are null. |
| Date Time Count | The time and date counts found in the field. |
| Selectivity | The ratio of Cardinality to the total number of values in the field, that is, the percentage of unique values. Use this field characteristic along with the Cardinality value when selecting a good seed for tagging. See Cardinality and selectivity calculations. |
| Max | The maximum value in the column. |
| Value Count | Total number of records in that file. The value distribution in each field is shown in the frequency graph. |
| String Count | When string data is found in the field, this indicates the number of strings. |
| Cardinality | The number of unique values in a field, where a low cardinality number indicates many repeated values. Use this field characteristic along with the Selectivity value when selecting a good seed for tagging. See Cardinality and selectivity calculations. |
| Density | The ratio of the Null Count to the Max count. Indicates the density of the data without the null values, where a number denotes that many rows are missing data for this field. |
Data summary pane
In Data Catalog, you can view metadata in graphical formats like pie charts, value histograms, and unique value counts to help you to quickly analyze data. You can also view quality metrics and sample values in addition to profiled samples. The metadata for the most frequent values from each field and the quality metrics, such as maximum, minimum, cardnality, and selectivity, are calculated on all field values during profiling.
To open a data type profile, navigate to the column in the resource that you want to view and click it to explore the field-level data.
When viewing column details, you can see the resource field-level metadata along with data analysis, discovered and seeded or accepted field tags, cardinality for fields, and sample values. To show metadata in the resource field, you need native access to the resource or metadata level as governed by the RBAC settings for your user role.
Depending on the selected resource level or data element, you can view different summaries of information, including the following resource metrics:
Displays a description of the resource that is imported from the source. You can contribute resource information to the knowledge base to write content and include links to other articles in Lumada Data Catalog. You can also access and communicate the usage history of the resource. To edit, click Edit Description. The Description dialog box opens. Format the text using tools for font style, size, color, bold, and italic, or add mathematical formulas, code blocks, highlighting, quotation blocks, links, and inline images. You can also use the description text in a search string to search Data Catalog for resources containing similar strings.
Displays the description or comments imported from the data source. These descriptions are either imported from Hive/JDBC descriptions during processing or from non-Hive/JDBC resources through API calls. You cannot edit imported descriptions.
Communicates detailed data quality metrics for fields as derived from business rules. Trend indications reflect recent changes in the associated metric.
- Accuracy reflects the reality of the data and its conformity with a verifiable source.
- Completeness indicates whether the data is sufficient to be meaningful and actionable.
- Consistency is a measure of the same information, stored and used at multiple instances, matching values.
- Timeliness is the degree to which the data represents reality at a specific point in time.
- Uniqueness indicates whether the information is the only recorded instance in the data set used.
- Validity provides hints about the value attributes available for aligning within a range or requirement.
Provides a snapshot of the upstream sources and downstream destinations of the resource.
Displays the common data patterns profiled by Data Catalog and frequency in the form NN-AN-AAAA
when viewing a field. Special separator characters are also included, such as N for a numeric character and A for alphanumeric to identify the different
distributions.
If your user role does not grant access to the field or viewing level of the information, the Data Patterns pane does not appear.
When a column is selected, you can view the statistics for that column in the Content pane. See Content pane for details.
Shows the most frequently occurring values for the field along with the frequency and distribution when viewing a column. Text names and values are truncated after 256 characters. If your data includes strings that have only numbers, such as zip codes, Data Catalog displays the values as numbers without leading zeros. You can identify resources that have been sample-profiled and other resource-level information.
To view this pane, your role must allow Sample Data Access through native system permissions.
If your user role has administrative privileges, you can configure these values. If not, contact your administrator for details.
The Data Summaries pane contains the following details:
Tab views
Use these tabs to view different details and perform actions on the resource. You can also apply filters and edit the content that appears in these tabs. The tabs that appear vary according to the resource that is selected.
Summary tab
Scan overview information about the resource, including the path details, associated and suggested resource tags, profiling status, resource owner, and description of the resource.
Details tab
Explore detailed information about the table, including the column names, data types, length, keys, business terms, and owners. You can also apply filters and edit the details about the resource.
Properties tab
View the property name, description, and value details about the resource. You can also add and remove properties, apply filters, and edit the value of a property.
Glossary tab
Explore the business terms and business entities, and link information on the resource. It has Accepted/Suggested and Rejected tabs, which display the association details, such as Method Type, Term Acceptance, and Status of the respective business terms. You can use Show Columns to customize the display and apply filters using Show Filters.
You can add business terms or business entities using Add New and perform many operations. For more information, see Managing associations.
Use the tools under the Tab views to rate the data, see who is viewing the data, and to bookmark resources.
| Item | Description |
| Rating | Highlights the popularity of the resource by providing an average of all the user ratings. A low rating highlights an issue with the resource, such as incomplete data. |
| Bookmarks |
You can mark a resource as a favorite by clicking the Bookmarks icon for quick future reference. See Bookmarking resources |
Key Metrics
Explore key metrics and metadata for insights into the selected resource to make quick decisions. The processing engine discovers the resource metadata, and the AI engine calculates other data. Depending on your selected resource, you can view the following information panels:
View metadata attributes about the data source for deeper insights. For example, when you request access to a resource, a high-sensitivity level promptly warrants a thorough check of the permission and access levels of your user role.
Computed metadata attribute that identifies the sensitivity of the resource. It is based on the highest sensitivity level of any term (field or resource) associated or suggested on the resource. For example, if a single term contains high sensitivity, then the resource sensitivity is automatically set to high and appears with the High Sensitivity icon. Sensitivity levels are defined as follows:
| Icon | Level | Description |
 | High | Identifies highly-sensitive data for personally identifying information, such as bank account numbers, SSN, PAN, credit card numbers, and employee IDs. |
 | Medium | Identifies medium sensitivity for data like names, addresses, and marital status. |
 | Low | Identifies low sensitivity for data that may be personally identifiable but with lower sensitivity. |
 | Non-sensitive | Identifies data that AI has determined is not sensitive because no sensitivity label was associated with that resource after processing and curation. |
 | Unknown sensitivity | Identifies data that needs to be processed to determine the sensitivity. |
Indicates how well this resource is curated. For example, multiple content updates performed on the resource like updating or adding description, lineage, tags, and reviews increase the activity score. The amount of the Activity icon that is filled indicates the level of curation, as follows:
| Level | Description |
| High | Curation level is more than 30 and is considered high. |
| Medium | Curation level is between 10 and 30. |
| Low | Curation level is less than 10. |
| None | Not curated. |
Status panel
Lists the resource profile status of jobs that run on the resource. Click the displayed status of a profiled source to view the details and the timestamp of the last update.
Profiled
The discovery job(s) ran successfully. You can view the time stamp of the last successful profile job.
Not Yet
When no Data Catalog job has processed the file yet.
Business Terms
Lists associated discovered and suggested business terms for the resource. If no terms are associated with a resource, you can click Add Term to open the Business Terms dialog box and add terms on the resource. Both associated and suggested terms are listed with any "overflow" terms indicated by an overflow number link. Click this link to display all the terms in a separate dialog box.
Source Properties
On the Source Properties panel, view a summary of the Properties tab, incuding the connection, resource type and name. Lumada Data Catalog discovers seven resource properties by default.
Statistics panel
View information about discovered metadata in a field including the data type and frequency. You can view the data statistics for the column in a donut chart, which specifies how much of the data are null values. See Content pane for a description of the fields when a column is selected.
Item Properties
View the original name of the database for a table or the field name and value for a column level resource. You can view whether the selected item is nullable, the column size, the data type, and the database name. Click View All to see detailed information on the Properties page for the resource.
Users designated by an admin appear as experts for the resource. Experts are expected to know the resource data details, its application, and the implication of any changes being done on the resource. The list of experts is a computed list.
Bookmarking resources
In Lumada Data Catalog, you can add a resource as a bookmark. In the Collaboration bar of the Data Canvas, click the Bookmarks icon for a file, table, database, or folder to include as a resource in your bookmarks list. You have easy access to bookmarked resources from the toolbar. Bookmarks are private for each user role and are stored individually.
To delete a bookmark that is no longer useful, click the Bookmarks icon, then locate and select the name of the bookmark you want to delete and click Remove.
Cardinality and selectivity calculations
Lumada Data Catalog calculates cardinality based on a data subset in the field. Cardinality is an approximate value. It is more accurate if the number of unique values in the field is lower than 2000. This tipping point of 2000 values can be configured by your Data Catalog administrator.
When fields include more than one type of value (all numbers or a combination of numbers and letters), the data profiles apply from the perspective of one data type. For example, the text profile shows statistics calculated with only the text values and indicates the non-text and null values.
Cardinality and selectivity for a certain data type show what part of the total field values are of that type. The sum of cardinality across all data types is the number of values in the field. The sum of selectivity across all data types is 1.
Sample-profiled resources
In Lumada Data Catalog's browser, you can identify resources that have been sample-profiled and other resource-level information.
If a large resource is profiled with the -sample parameter, the Statistics panel identifies its aggregated analysis and lists the number of rows sampled. The details in the Status panel also identify this resource as sample-profiled.