Data rationalization

You can use the data rationalization feature to identify and analyze copies and overlaps of the data in your data lake. The tools in the data rationalization dashboard help you to discover the owners of duplicate files, the number of duplicates, and the amount of space that they are consuming. Identifying duplicates can help your organization save on storage costs, reduce the size of your data lake, and improve your search performance.
After you run a Run a Data Rationalization job to provide the most recent data in your dashboard, you can begin to search for overlaps and copies. An overlap is a file that contains part, but not all of the data that another file contains, while a copy is a form of overlap that is a content copy. The job compares the field values of the files to determine copies. A copy of a file can have the same contents even if the file name is different. Because the duplicate files may have different names, they are gathered into copy groups. You can use the analytic and drill-down tools in the dashboard to investigate copy groups and data overlap relationships.
Data rationalization provides your organization with the following benefits:
- You can de-clutter your data lake for improved search performance.
- You can identify duplicate files so you can delete them and save on storage costs and reduce the volume of files.
- You can identify deprecated versions of files to make sure users are using the correct version.
- You can manage the redundancy of sensitive data to mitigate security risks and ensure compliance with security regulations.
Tour the Rationalization dashboard
You can use the Data Rationalization dashboard to view details of duplicate copies of files that contain overlapping data in your data lake. This dashboard offers a drill-down interactive menu for copy or overlap analysis of resources grouped by size, owner, volume, and source so you can identify business assets to manage redundancies. For security, the data comparison is restricted to the resources that the user has access to.
Before you can use the Data Rationalization dashboard, you must first Run a Data Rationalization job to provide data for the dashboard to display. The dashboard displays real-time data from the time when the job is run.
To open the Data Rationalization dashboard, select DATA RATIONALIZATION on the Home page.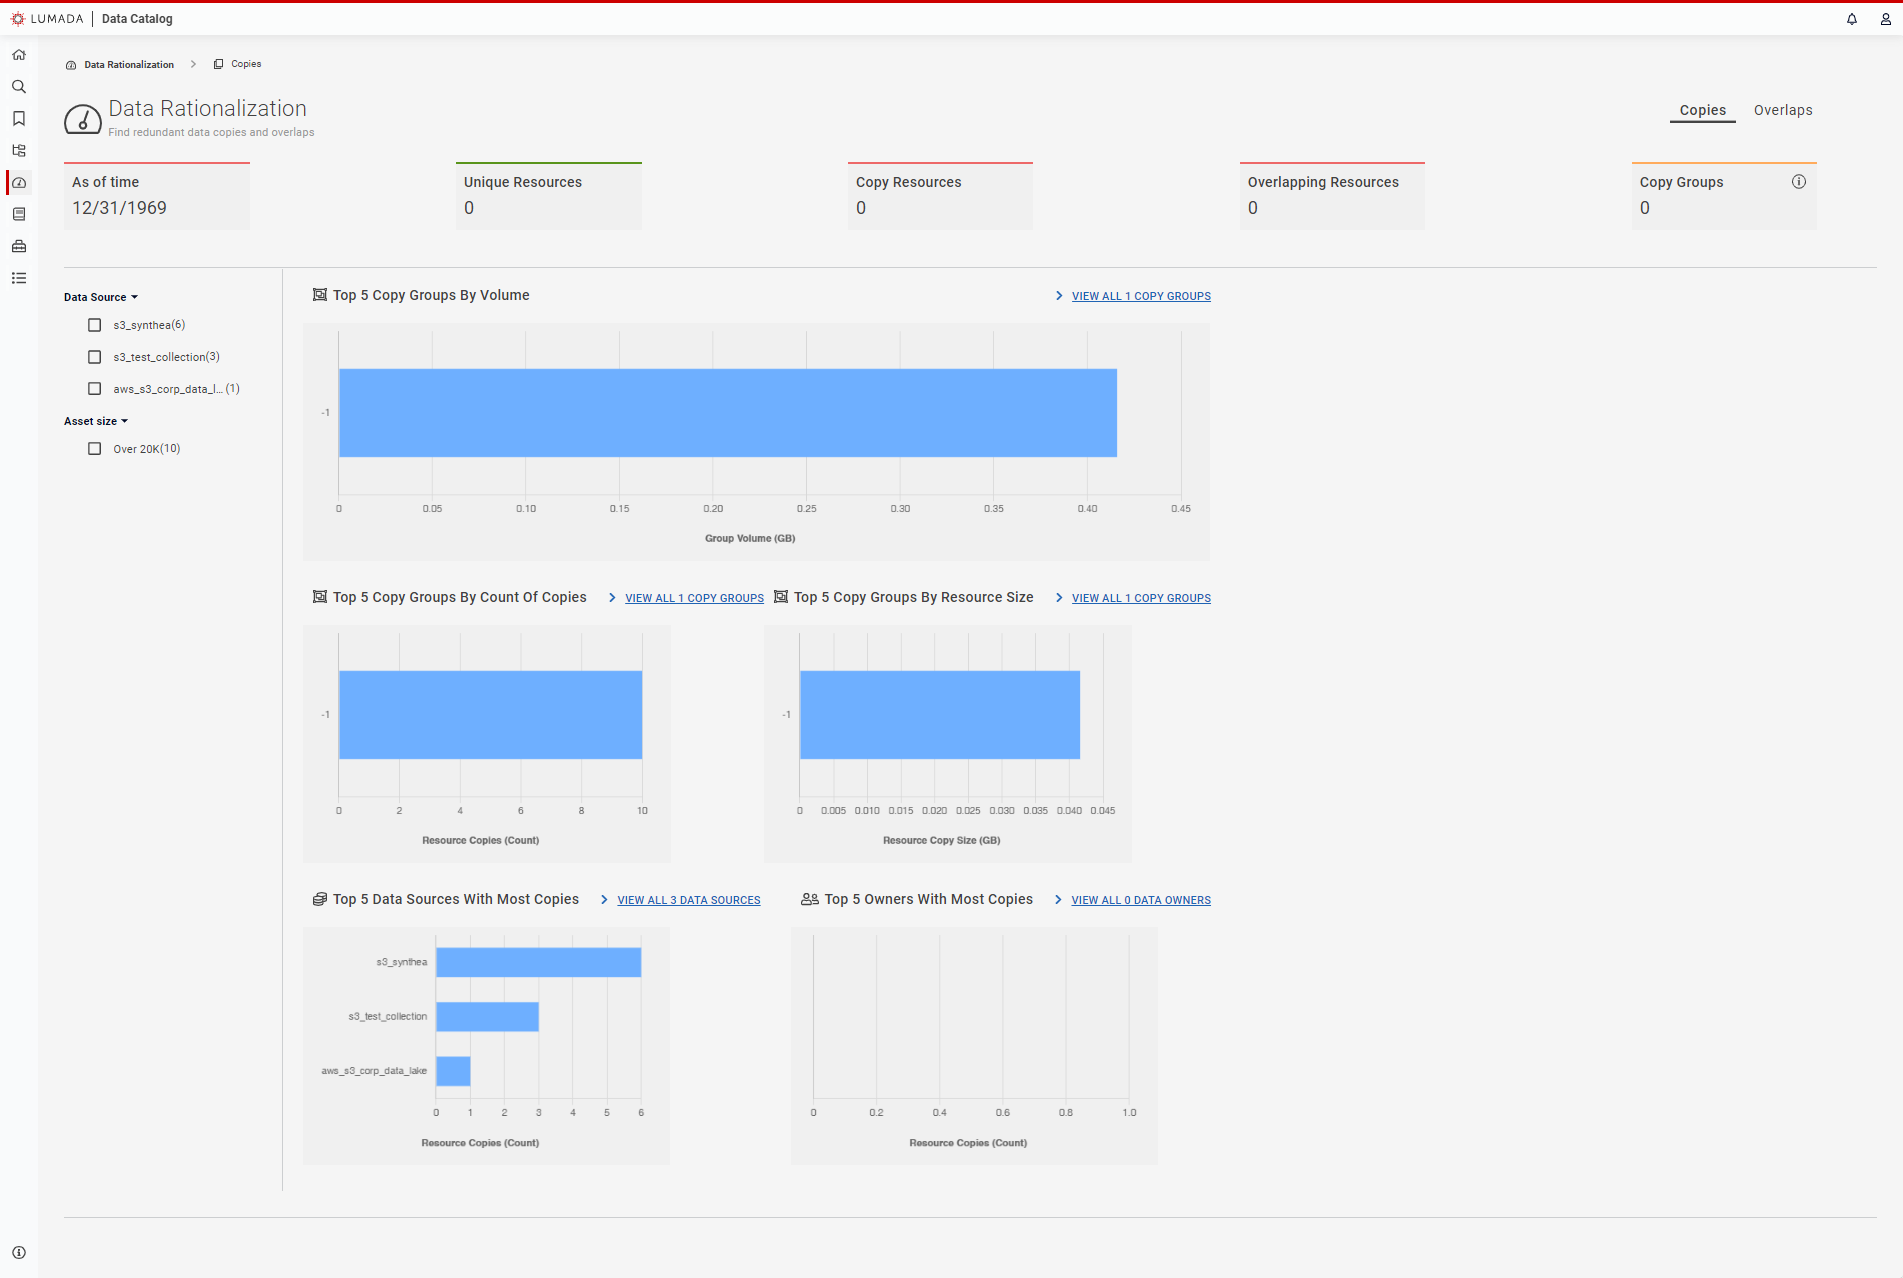
When the dashboard appears, you can view the following summary information:
As Of Time
Time that the data rationalization job was most recently run. All information is current up to this date and time.
Unique Resources
Total number of resources that are not copies of anything else, including tables, files, and collection roots.
Copy Resources
Total number of resources that are a copy of at least one other resource.
Overlapping Relationships
Total number of resources that overlap with at least one other resource. Overlapping refers to files that either contains part of another file or files that are copies.
Copy Groups
Total number of discovered copy groups.
In the Data Rationalization dashboard, select the Copies tab to investigate duplicate data, or select the Overlaps tab to use tools to investigate overlapping data.
Working with copies
After you run the Data Rationalization job, the Data Rationalization dashboard displays summary information of the analysis. At a glance, you can view the numbers of unique resources compared to copy resources and the total number of overlapping relationships and copy groups.
When copy groups are present, you can view a further breakdown of the data as reports based on properties:
Top 5 Copy Groups By Volume
The amount of storage space the largest five groups of duplicate files consume.
Top 5 Copy Groups By Count Of Copies
The number of files the largest five groups of duplicate files consume.
Top 5 Copy Groups By Resource Size
The size of the files with duplicate copies consuming the most resources. For example, the group may contain a few large files, so those copies consume a lot of storage space.
Top 5 Data Sources With Most Copies
The data sources with the largest number of copies.
Top 5 Owners With Most Copies
The data source owners with the largest number of copies.
You can explore all the copy groups within a report by clicking the View All link on each report. The available data for each copy group appears in a table format. For a quick look, you can mouse over a bar graph to view the name of the copy group with either the exact count of the group or the volume of the group by size in megabytes.
You can drill down into data sources and files to quickly investigate your duplicates by clicking the bar graph in a report to view further information about that copy group or data source. For example, to explore the top copy group identified in the Top 5 Copy Groups By Resource Size report, click the bar graph of the copy group to view the list of included resources. From here, you can click a resource to open it in the Data Canvas view to explore the fields.
Working with overlaps
Overlaps contain mostly the same data, but are not perfect copies. For example, modifications to a small percentage of the file may have occurred from enrichment activities, such as adding or deleting a couple of rows or columns in a table. Or the field order may be different in a copy of a file. To view the overlaps detected in your system, click Overlaps to display the tab.
The Overlaps tab offers three reports: the Top 5 Resources With Most Overlap, Top 5 Data Sources With Most Overlap, and the Top 5 Owners With Most Overlap. Drill down into the reports to determine if these overlaps are the result of preparatory activity around a file and if this particular file needs to be stored in your data lake.
You can explore all the resources and data sources within a report by clicking the View All button on each report. The available data for that resource or data source appears in a table format. For a quick look, you can mouse over a bar graph to view the name of the source with either the exact count of the overlaps or the volume of the overlaps by size in megabytes (MB).
You can drill down into data sources and files to investigate your overlaps by clicking the bar graph in a report. From there, you can click a resource to open it in the Data Canvas view to explore the fields.